
Avalanche (AVAX) technical analysis:
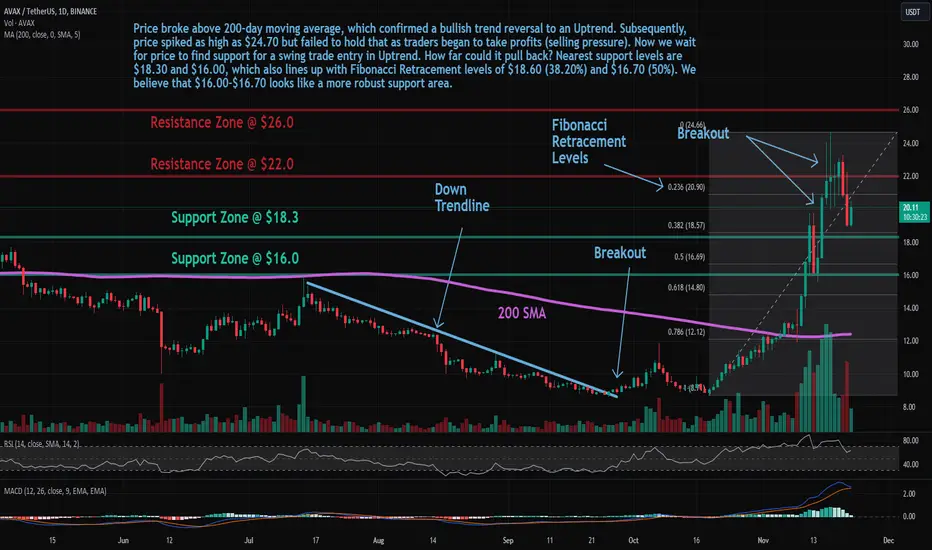
Trade setup: Price broke above 200-day moving average, which confirmed a bullish trend reversal to an Uptrend. Subsequently, price spiked as high as $24.70 but failed to hold that as traders began to take profits (selling pressure). Now we wait for price to find support for a swing trade entry in Uptrend. How far could it pull back? Nearest support levels are $18.30 and $16.00, which also lines up with Fibonacci Retracement levels of $18.60 (38.20%) and $16.70 (50%). We believe that $16.00-$16.70 looks like a more robust support area.
Trend: Uptrend across all time horizons (Short- Medium- and Long-Term).
Momentum is Bullish but inflecting. MACD Line is above MACD Signal Line and RSI is above 55 but momentum may have peaked since MACD Histogram bars are declining, which suggests that momentum is weakening.
Support and Resistance: Nearest Support Zone is $18.3 (previous resistance), then $16.0. The nearest Resistance Zone is $22.0, then $26.0.
Trade setup: Price broke above 200-day moving average, which confirmed a bullish trend reversal to an Uptrend. Subsequently, price spiked as high as $24.70 but failed to hold that as traders began to take profits (selling pressure). Now we wait for price to find support for a swing trade entry in Uptrend. How far could it pull back? Nearest support levels are $18.30 and $16.00, which also lines up with Fibonacci Retracement levels of $18.60 (38.20%) and $16.70 (50%). We believe that $16.00-$16.70 looks like a more robust support area.
Trend: Uptrend across all time horizons (Short- Medium- and Long-Term).
Momentum is Bullish but inflecting. MACD Line is above MACD Signal Line and RSI is above 55 but momentum may have peaked since MACD Histogram bars are declining, which suggests that momentum is weakening.
Support and Resistance: Nearest Support Zone is $18.3 (previous resistance), then $16.0. The nearest Resistance Zone is $22.0, then $26.0.

Clause de non-responsabilité
Les informations et publications ne sont pas destinées à être, et ne constituent pas, des conseils ou recommandations financiers, d'investissement, de trading ou autres fournis ou approuvés par TradingView. Pour en savoir plus, consultez les Conditions d'utilisation.
Clause de non-responsabilité
Les informations et publications ne sont pas destinées à être, et ne constituent pas, des conseils ou recommandations financiers, d'investissement, de trading ou autres fournis ou approuvés par TradingView. Pour en savoir plus, consultez les Conditions d'utilisation.