
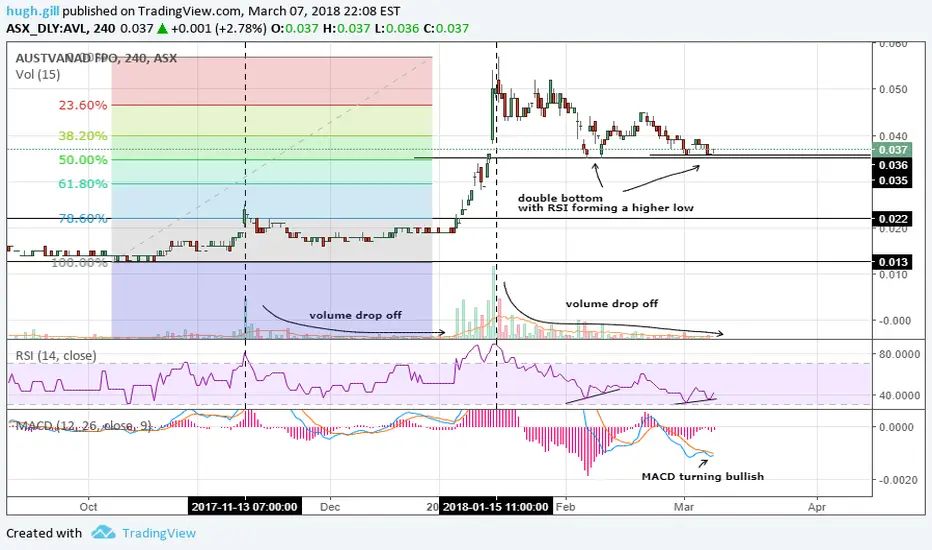
AVL has had a nice run up in price and has recently pulled back about 40% before finding support on the 50% FIB level..
Bullish Indicators:
Double Bottom on 50% Fib
Higher Low on 50% Fib
RSI creating higher low on 4 hour chart (showing strength)
Monthly RSI cooled off.
Volume has dropped off significantly. (usually see this before a big pump)
I noticed this exact set up on another chart KRC screenshot below

Entry .036 - .037
Target .065
Stoploss .034
Stoploss
Bullish Indicators:
Double Bottom on 50% Fib
Higher Low on 50% Fib
RSI creating higher low on 4 hour chart (showing strength)
Monthly RSI cooled off.
Volume has dropped off significantly. (usually see this before a big pump)
I noticed this exact set up on another chart KRC screenshot below
Entry .036 - .037
Target .065
Stoploss .034
Stoploss
Transaction en cours
KRC Weekly RSI CooloffAVL Weekly RSI Cooloff

Publications connexes
Clause de non-responsabilité
Les informations et publications ne sont pas destinées à être, et ne constituent pas, des conseils ou recommandations financiers, d'investissement, de trading ou autres fournis ou approuvés par TradingView. Pour en savoir plus, consultez les Conditions d'utilisation.
Publications connexes
Clause de non-responsabilité
Les informations et publications ne sont pas destinées à être, et ne constituent pas, des conseils ou recommandations financiers, d'investissement, de trading ou autres fournis ou approuvés par TradingView. Pour en savoir plus, consultez les Conditions d'utilisation.