
Disclaimer:
This analysis is for educational purposes only. I am not a SEBI-registered advisor. This is not financial advice.
Symbol: AXISBANK (NSE)
Date Observed: 13 November 2024
Time Frame: 15-Minute Chart
This post documents a historical intraday observation using the Gann Square of 9, focusing on how normal price movement capacity interacts with time to highlight potential reaction zones.
📊 Initial Market Structure
Axis Bank showed upward momentum from the first 15-minute candle.
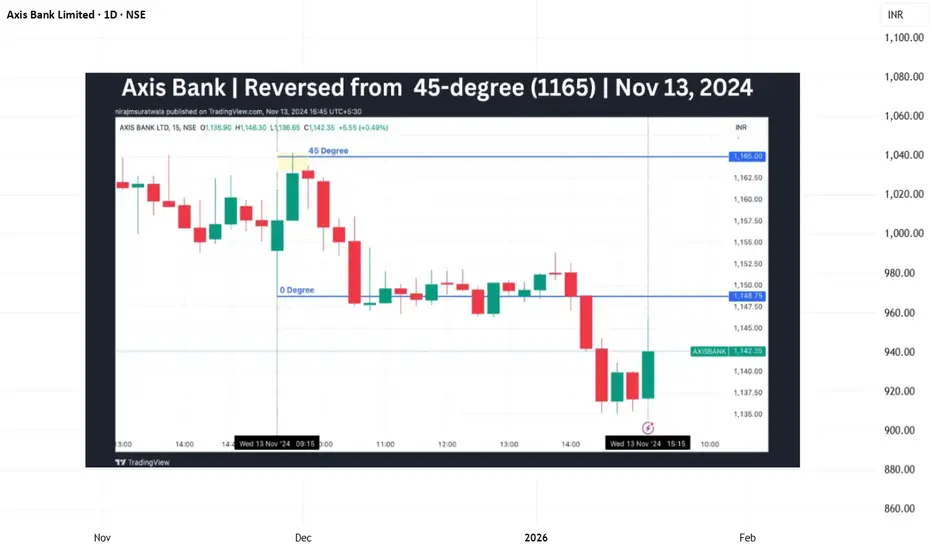
The low of the opening candle (~1148) was treated as the 0-degree reference level, following standard Square of 9 practice.
This reference point acts as the base for mapping the day’s expected upward vibration.
Correct identification of the 0-degree is essential for meaningful Square of 9 observations.
🔢 Gann Square of 9 Level Mapping
Based on Square of 9 calculations:
0 Degree: ~1148
45 Degree (Observed Normal Capacity): ~1165
In intraday studies, the 45-degree level often represents a stock’s normal price expansion range under regular market conditions.
⏱️ Price & Time Interaction (Observed Behavior)
Price reached the 45-degree level early in the session (around the second 15-minute candle).
Completion of the normal price capacity well before the later part of the trading day has historically shown temporary price pressure.
After interacting with this zone, the market displayed rejection behavior and short-term downside expansion.
This reflects a commonly observed Gann principle:
Early completion of expected price capacity can increase the probability of a reaction.
📘 Key Educational Takeaways
📌 Shared purely for educational and historical chart-study purposes.
#AxisBank #GannSquareOf9 #WDGann #IntradayAnalysis #MarketEducation #TechnicalAnalysis #PriceTime
This analysis is for educational purposes only. I am not a SEBI-registered advisor. This is not financial advice.
Symbol: AXISBANK (NSE)
Date Observed: 13 November 2024
Time Frame: 15-Minute Chart
This post documents a historical intraday observation using the Gann Square of 9, focusing on how normal price movement capacity interacts with time to highlight potential reaction zones.
📊 Initial Market Structure
Axis Bank showed upward momentum from the first 15-minute candle.
The low of the opening candle (~1148) was treated as the 0-degree reference level, following standard Square of 9 practice.
This reference point acts as the base for mapping the day’s expected upward vibration.
Correct identification of the 0-degree is essential for meaningful Square of 9 observations.
🔢 Gann Square of 9 Level Mapping
Based on Square of 9 calculations:
0 Degree: ~1148
45 Degree (Observed Normal Capacity): ~1165
In intraday studies, the 45-degree level often represents a stock’s normal price expansion range under regular market conditions.
⏱️ Price & Time Interaction (Observed Behavior)
Price reached the 45-degree level early in the session (around the second 15-minute candle).
Completion of the normal price capacity well before the later part of the trading day has historically shown temporary price pressure.
After interacting with this zone, the market displayed rejection behavior and short-term downside expansion.
This reflects a commonly observed Gann principle:
Early completion of expected price capacity can increase the probability of a reaction.
📘 Key Educational Takeaways
- Square of 9 helps define logical intraday price limits
- Normal (45-degree) reactions occur more frequently than rare cases
- Combining price structure with time context improves clarity
- The method supports rule-based observation, not prediction
- Small variations around levels are part of normal market behavior
📌 Shared purely for educational and historical chart-study purposes.
#AxisBank #GannSquareOf9 #WDGann #IntradayAnalysis #MarketEducation #TechnicalAnalysis #PriceTime

Publications connexes
Clause de non-responsabilité
Les informations et publications ne sont pas destinées à être, et ne constituent pas, des conseils ou recommandations financiers, d'investissement, de trading ou autres fournis ou approuvés par TradingView. Pour en savoir plus, consultez les Conditions d'utilisation.
Publications connexes
Clause de non-responsabilité
Les informations et publications ne sont pas destinées à être, et ne constituent pas, des conseils ou recommandations financiers, d'investissement, de trading ou autres fournis ou approuvés par TradingView. Pour en savoir plus, consultez les Conditions d'utilisation.