
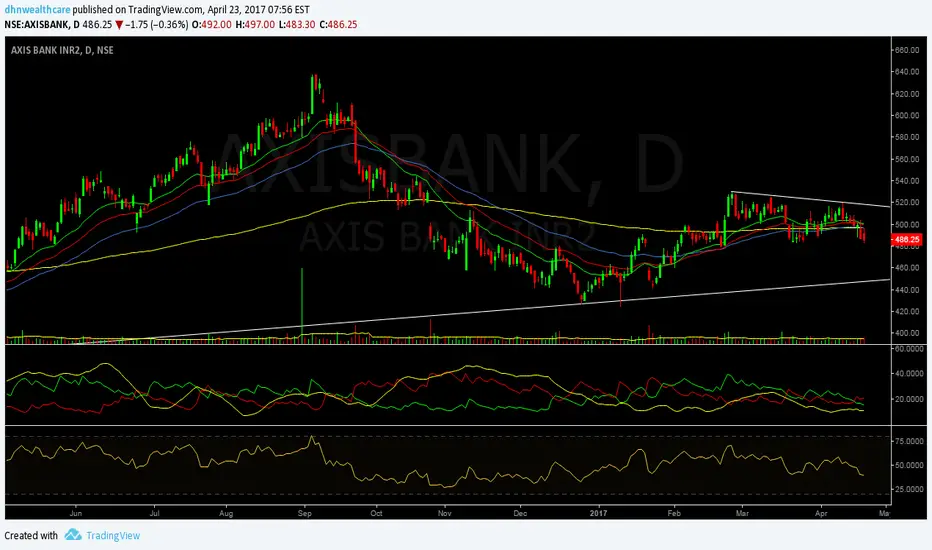
Chart of Axis Bank is suggesting weakness in stock price in coming days. Stock has closed below all short and long term moving averages. Additionally RSI and ADX has given negative divergence on both daily as well as weekly charts.
One can initiate short position on stock between 483-487 levels with stop loss of 521 (last up swing move) for target of 450 in coming 4-6 weeks.
One can initiate short position on stock between 483-487 levels with stop loss of 521 (last up swing move) for target of 450 in coming 4-6 weeks.

Clause de non-responsabilité
Les informations et publications ne sont pas destinées à être, et ne constituent pas, des conseils ou recommandations financiers, d'investissement, de trading ou autres fournis ou approuvés par TradingView. Pour en savoir plus, consultez les Conditions d'utilisation.
Clause de non-responsabilité
Les informations et publications ne sont pas destinées à être, et ne constituent pas, des conseils ou recommandations financiers, d'investissement, de trading ou autres fournis ou approuvés par TradingView. Pour en savoir plus, consultez les Conditions d'utilisation.