
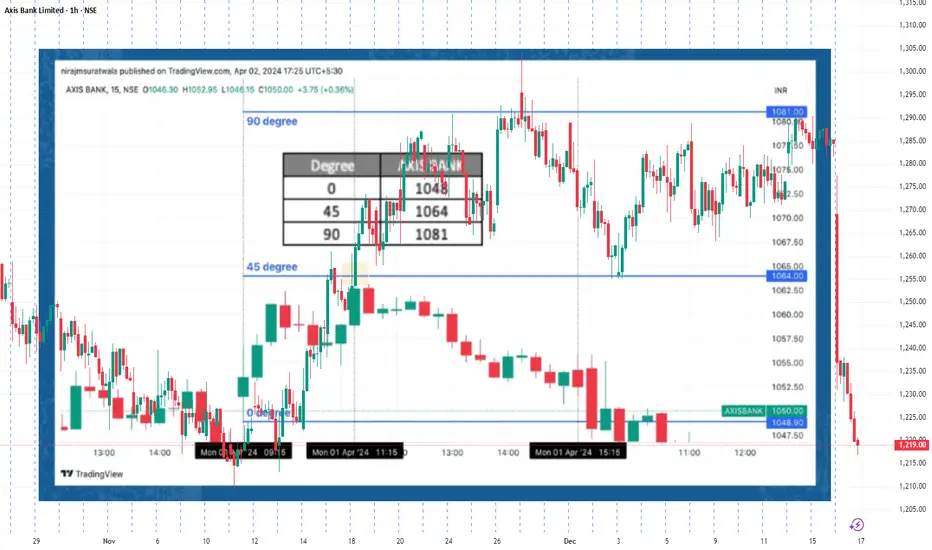
This idea presents an intraday case study demonstrating how WD Gann’s Square of 9 can be applied to identify probable resistance zones using price–angle relationships.
On 01 April 2024, Axis Bank showed early intraday strength after the opening session.
The first 15-minute low was used as the 0-degree reference point, following classical Gann methodology.
Based on Square of 9 calculations, the following projected levels were derived:
• 45° level (normal intraday capacity) → 1064
• 90° level (expanded / rare capacity) → 1081
As price advanced during the session, it approached the 45-degree level before the late-session time window. Around this zone, price showed clear hesitation and rejection, followed by intraday weakness.
🔍 Key Observations from This Study
• Use the first intraday pivot to define the 0-degree base
• Calculate angle-based projections using Square of 9 logic
• Observe time alignment when price reaches projected levels
• Reactions near 45° often indicate normal resistance behaviour
This example highlights how rule-based price geometry helps traders study intraday behaviour in a structured and disciplined way, without relying on indicators.
Disclaimer:
This post is shared strictly for educational and chart-analysis purposes only.
It is not a trading recommendation or financial advice.
On 01 April 2024, Axis Bank showed early intraday strength after the opening session.
The first 15-minute low was used as the 0-degree reference point, following classical Gann methodology.
Based on Square of 9 calculations, the following projected levels were derived:
• 45° level (normal intraday capacity) → 1064
• 90° level (expanded / rare capacity) → 1081
As price advanced during the session, it approached the 45-degree level before the late-session time window. Around this zone, price showed clear hesitation and rejection, followed by intraday weakness.
🔍 Key Observations from This Study
• Use the first intraday pivot to define the 0-degree base
• Calculate angle-based projections using Square of 9 logic
• Observe time alignment when price reaches projected levels
• Reactions near 45° often indicate normal resistance behaviour
This example highlights how rule-based price geometry helps traders study intraday behaviour in a structured and disciplined way, without relying on indicators.
Disclaimer:
This post is shared strictly for educational and chart-analysis purposes only.
It is not a trading recommendation or financial advice.

Publications connexes
Clause de non-responsabilité
Les informations et publications ne sont pas destinées à être, et ne constituent pas, des conseils ou recommandations financiers, d'investissement, de trading ou autres fournis ou approuvés par TradingView. Pour en savoir plus, consultez les Conditions d'utilisation.
Publications connexes
Clause de non-responsabilité
Les informations et publications ne sont pas destinées à être, et ne constituent pas, des conseils ou recommandations financiers, d'investissement, de trading ou autres fournis ou approuvés par TradingView. Pour en savoir plus, consultez les Conditions d'utilisation.