
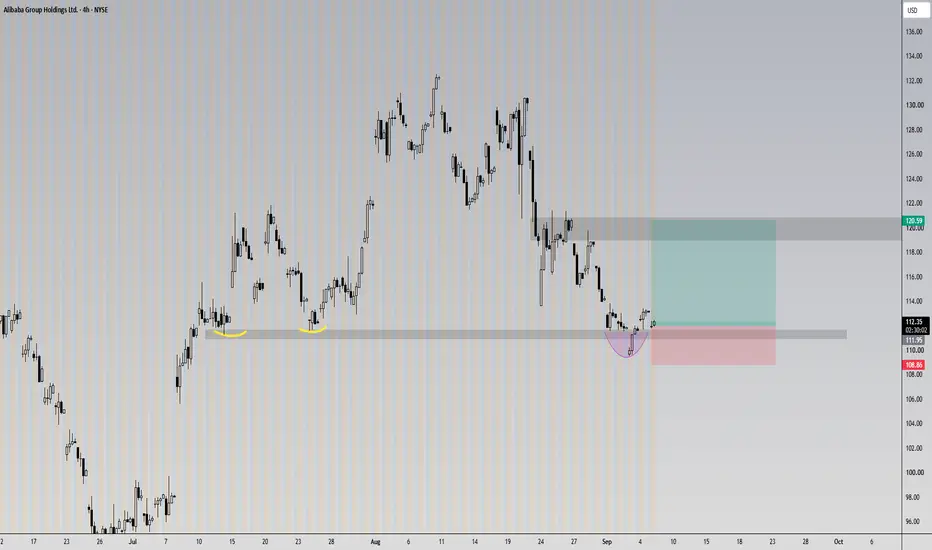
Tracking a classic liquidity sweep and deviation scenario in BABA's price action.
🎯 Setup & Expectation:
The price recently swept the sell-side liquidity resting below the relative equal lows marked with the yellow curves on the left (highlighted by the purple deviation zone).
Reclaiming the support level immediately after triggering those stops and creating a fake breakdown (bear trap) suggests that the downward momentum has exhausted and the bias is shifting to the upside. Following this liquidity grab, I expect the price to initiate a strong bullish move towards the upper main resistance zone (around the 120.50 level).
📍 Stop-loss can be placed below the recent swing low / the tip of the liquidity sweep wick (around 108.80).
🎯 Setup & Expectation:
The price recently swept the sell-side liquidity resting below the relative equal lows marked with the yellow curves on the left (highlighted by the purple deviation zone).
Reclaiming the support level immediately after triggering those stops and creating a fake breakdown (bear trap) suggests that the downward momentum has exhausted and the bias is shifting to the upside. Following this liquidity grab, I expect the price to initiate a strong bullish move towards the upper main resistance zone (around the 120.50 level).
📍 Stop-loss can be placed below the recent swing low / the tip of the liquidity sweep wick (around 108.80).

Clause de non-responsabilité
Les informations et publications ne sont pas destinées à être, et ne constituent pas, des conseils ou recommandations financiers, d'investissement, de trading ou autres fournis ou approuvés par TradingView. Pour en savoir plus, consultez les Conditions d'utilisation.
Clause de non-responsabilité
Les informations et publications ne sont pas destinées à être, et ne constituent pas, des conseils ou recommandations financiers, d'investissement, de trading ou autres fournis ou approuvés par TradingView. Pour en savoir plus, consultez les Conditions d'utilisation.