
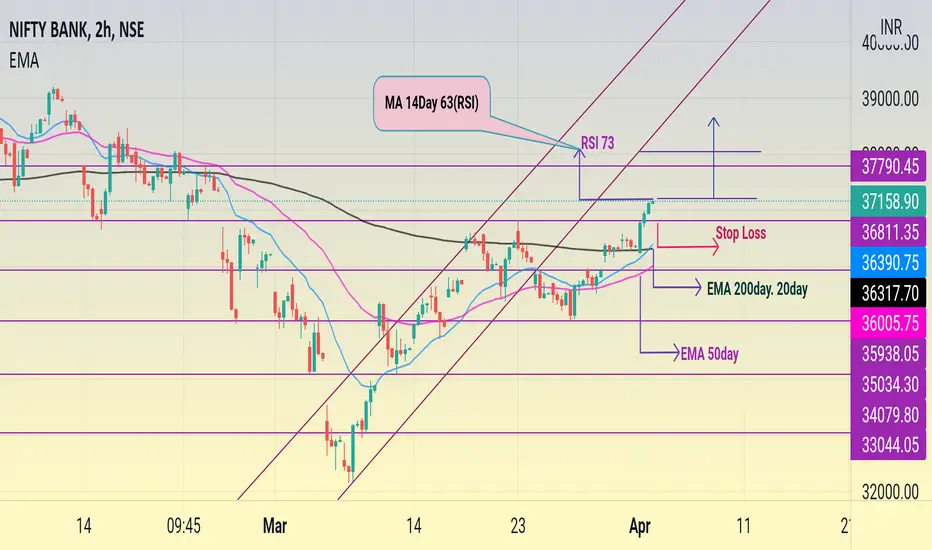
Bank Nifty 2 Hr Chart
Friday bullish Market 800 puls point High
EMA 200 and 20 day 36317 cross and high bank nifty
EMA 50 day 36005 .
RSI Friday closing 73 and MA 14 day 63 RSI
T1 37378
T2 37600
T3 37800
T4 38000
Stop loss 36850
This Chart are only educational purpose
Friday bullish Market 800 puls point High
EMA 200 and 20 day 36317 cross and high bank nifty
EMA 50 day 36005 .
RSI Friday closing 73 and MA 14 day 63 RSI
T1 37378
T2 37600
T3 37800
T4 38000
Stop loss 36850
This Chart are only educational purpose

Clause de non-responsabilité
Les informations et publications ne sont pas destinées à être, et ne constituent pas, des conseils ou recommandations financiers, d'investissement, de trading ou autres fournis ou approuvés par TradingView. Pour en savoir plus, consultez les Conditions d'utilisation.
Clause de non-responsabilité
Les informations et publications ne sont pas destinées à être, et ne constituent pas, des conseils ou recommandations financiers, d'investissement, de trading ou autres fournis ou approuvés par TradingView. Pour en savoir plus, consultez les Conditions d'utilisation.