
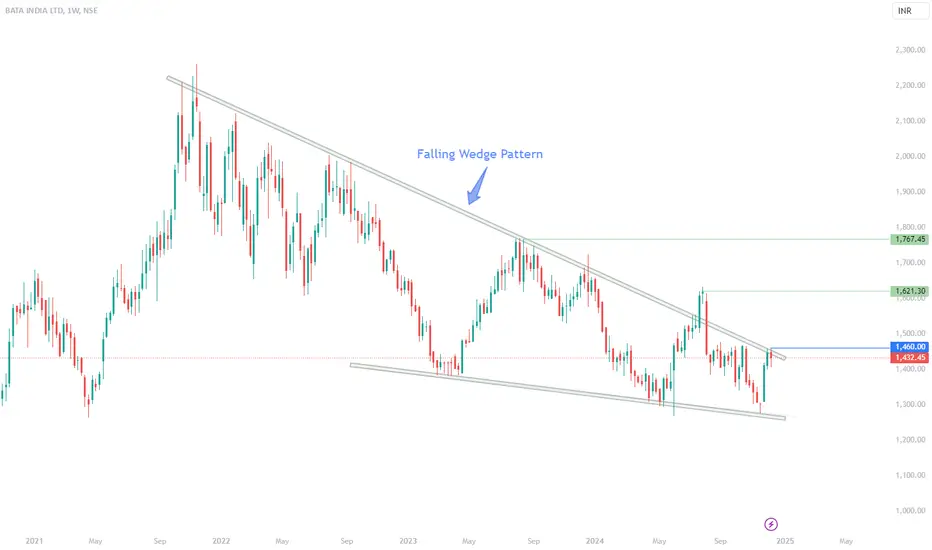
Weekly chart of BATA shows a beautiful Falling Wedge pattern.
The last candle is an inside candle from the previous week, suggesting a brief pause before the up move.
Any break above 1460 can result in a good move on the upside.
Fall below 1400 may be a continuation of the falling wedge pattern.
The last candle is an inside candle from the previous week, suggesting a brief pause before the up move.
Any break above 1460 can result in a good move on the upside.
Fall below 1400 may be a continuation of the falling wedge pattern.

Clause de non-responsabilité
Les informations et publications ne sont pas destinées à être, et ne constituent pas, des conseils ou recommandations financiers, d'investissement, de trading ou autres fournis ou approuvés par TradingView. Pour en savoir plus, consultez les Conditions d'utilisation.
Clause de non-responsabilité
Les informations et publications ne sont pas destinées à être, et ne constituent pas, des conseils ou recommandations financiers, d'investissement, de trading ou autres fournis ou approuvés par TradingView. Pour en savoir plus, consultez les Conditions d'utilisation.