
Bic has a p/e ratio of 6.5. 4.7% dividend yield.
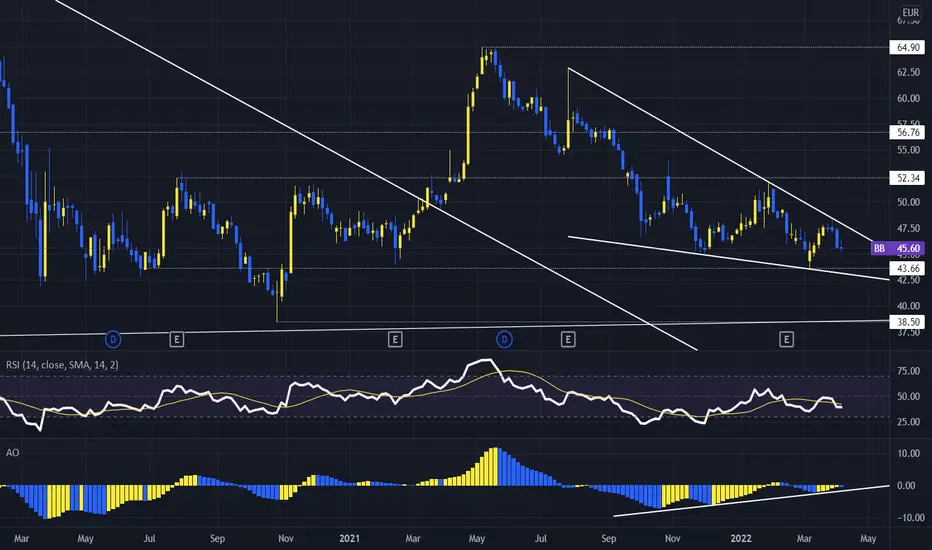
Has been down trending since 2015 and is now range bound with a high of 64.9 and a low of 38.5.
Printing a falling wedge which is a bullish reversal pattern.
RSI struggling with breaking into bullish territory at the 50 level.
AO showing bullish divergence and no real momentum.
Key levels indicated by horizontals show support and resistance.
Will tag on monthly analysis.
Has been down trending since 2015 and is now range bound with a high of 64.9 and a low of 38.5.
Printing a falling wedge which is a bullish reversal pattern.
RSI struggling with breaking into bullish territory at the 50 level.
AO showing bullish divergence and no real momentum.
Key levels indicated by horizontals show support and resistance.
Will tag on monthly analysis.
Note
Close to the bottom of macro channel. Hopefully will be able to buy on the channel otherwise watch out for falling wedge breakout.
Note
Solid 20+% gain after entry.RSI oversold on the day.
Multiple bear divs on lower tf.
Taking some off the table into strength here as we come into resistance.

Clause de non-responsabilité
Les informations et publications ne sont pas destinées à être, et ne constituent pas, des conseils ou recommandations financiers, d'investissement, de trading ou autres fournis ou approuvés par TradingView. Pour en savoir plus, consultez les Conditions d'utilisation.
Clause de non-responsabilité
Les informations et publications ne sont pas destinées à être, et ne constituent pas, des conseils ou recommandations financiers, d'investissement, de trading ou autres fournis ou approuvés par TradingView. Pour en savoir plus, consultez les Conditions d'utilisation.