
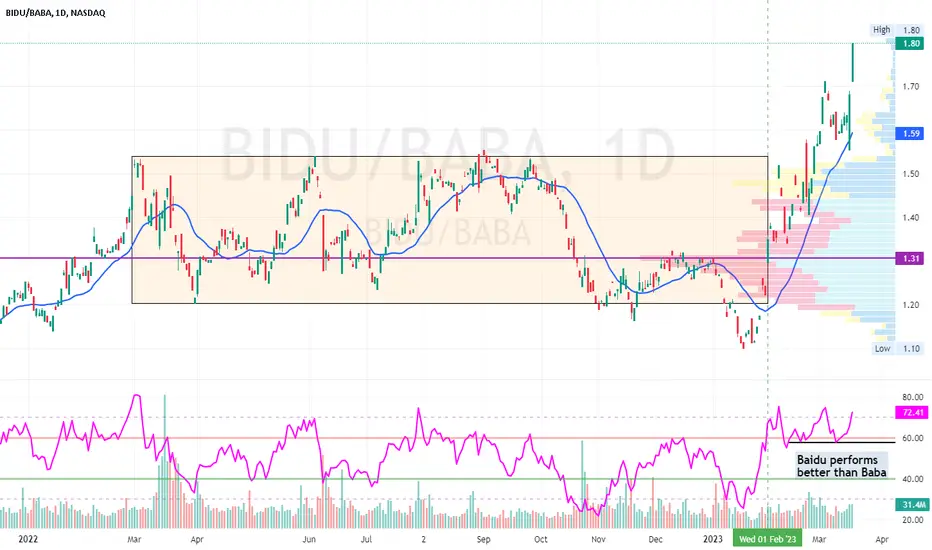
One year Daily Chart
a simple comparison by dividing #BIDU / #BABA
The ratio has been kept mostly within 1.20 ~ 1.5+
Daily RSI starts to surpass 60, which potentially starts a bullish move
*** in this case, meaning Baidu will potentially starts to outperform Baba for quite sometime)
The ratio finally surpass 1.50+ again and has since mark a new High
RSI continues to stays along high levels
so long RSI did not break below leveled support, Baidu will perform better than Baba
a simple comparison by dividing #BIDU / #BABA
The ratio has been kept mostly within 1.20 ~ 1.5+
Daily RSI starts to surpass 60, which potentially starts a bullish move
*** in this case, meaning Baidu will potentially starts to outperform Baba for quite sometime)
The ratio finally surpass 1.50+ again and has since mark a new High
RSI continues to stays along high levels
so long RSI did not break below leveled support, Baidu will perform better than Baba
Note
a total reversal! now Baba is better, ratio may gradualy drop back along 1.2 area
Clause de non-responsabilité
Les informations et publications ne sont pas destinées à être, et ne constituent pas, des conseils ou recommandations financiers, d'investissement, de trading ou autres fournis ou approuvés par TradingView. Pour en savoir plus, consultez les Conditions d'utilisation.
Clause de non-responsabilité
Les informations et publications ne sont pas destinées à être, et ne constituent pas, des conseils ou recommandations financiers, d'investissement, de trading ou autres fournis ou approuvés par TradingView. Pour en savoir plus, consultez les Conditions d'utilisation.