Long
BLOKUSDT
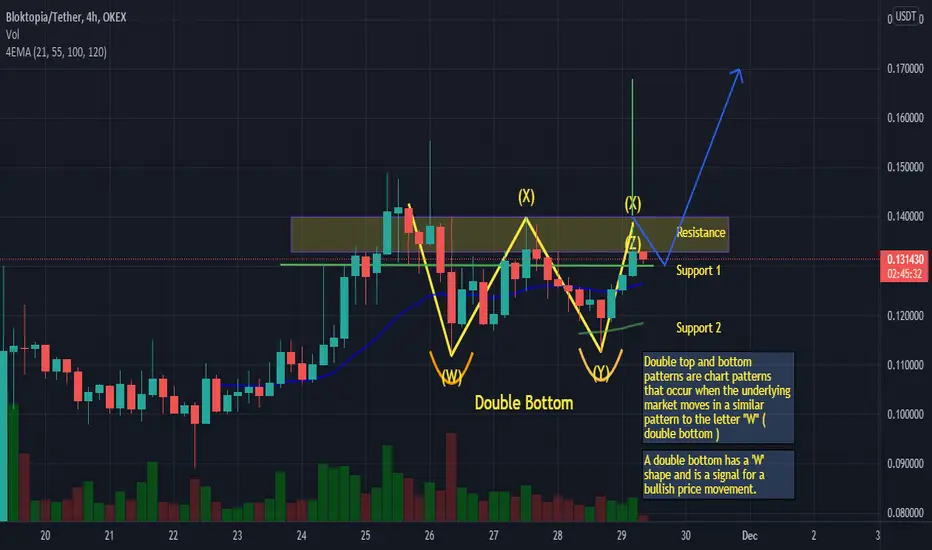
Double top and bottom patterns are chart patterns that occur when the underlying market moves in a similar pattern to the letter "W" ( double bottom )
A double bottom has a 'W' shape and is a signal for a bullish price movement.
If BLOK breaks R1 Region 0.13000-0.14000
Then
it can go to 0.17000-0.20000
A double bottom has a 'W' shape and is a signal for a bullish price movement.
If BLOK breaks R1 Region 0.13000-0.14000
Then
it can go to 0.17000-0.20000

Clause de non-responsabilité
Les informations et publications ne sont pas destinées à être, et ne constituent pas, des conseils ou recommandations financiers, d'investissement, de trading ou autres fournis ou approuvés par TradingView. Pour en savoir plus, consultez les Conditions d'utilisation.
Clause de non-responsabilité
Les informations et publications ne sont pas destinées à être, et ne constituent pas, des conseils ou recommandations financiers, d'investissement, de trading ou autres fournis ou approuvés par TradingView. Pour en savoir plus, consultez les Conditions d'utilisation.