
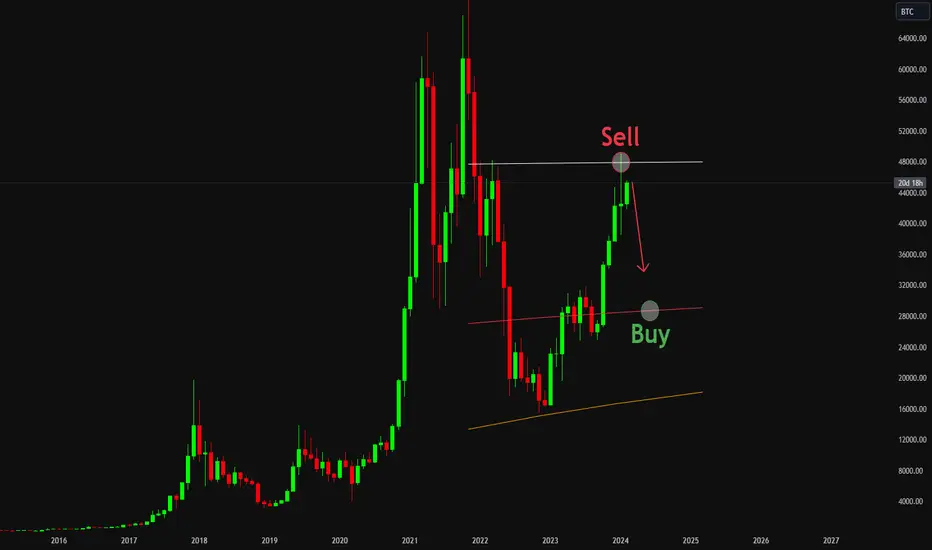
After rejecting off the L1 ( white line ) in the second week of January @48k my next target by default is the L2 ( red line ) @30k by the end of Q2 or beginning of Q3.
These support & resistance levels are calculated using my proprietary tool called LifeLines. Think of them as moving averages on steroids.
I doubt that this happens but in the case that we close the month of February above 48k then I will be waiting for a closure below again before entering another position. In other words I am very confident that we will see a greater pullback before continuing the greater trend to the upside.
Stop loss @49k
Note
Unfortunately I underestimated the power of this move ( my mistake ) & our next sell target has risen to approximately 55k as shown in the updated chart above [ purple line ( L0 ) ].
After surpassing our local high @48k my stop loss was triggered @49k.
There is a little more room for BLX to go before pulling back to the L2 ( red line ). As a result I have sell orders awaiting to be triggered @54-55k.

Clause de non-responsabilité
Les informations et publications ne sont pas destinées à être, et ne constituent pas, des conseils ou recommandations financiers, d'investissement, de trading ou autres fournis ou approuvés par TradingView. Pour en savoir plus, consultez les Conditions d'utilisation.
Clause de non-responsabilité
Les informations et publications ne sont pas destinées à être, et ne constituent pas, des conseils ou recommandations financiers, d'investissement, de trading ou autres fournis ou approuvés par TradingView. Pour en savoir plus, consultez les Conditions d'utilisation.