
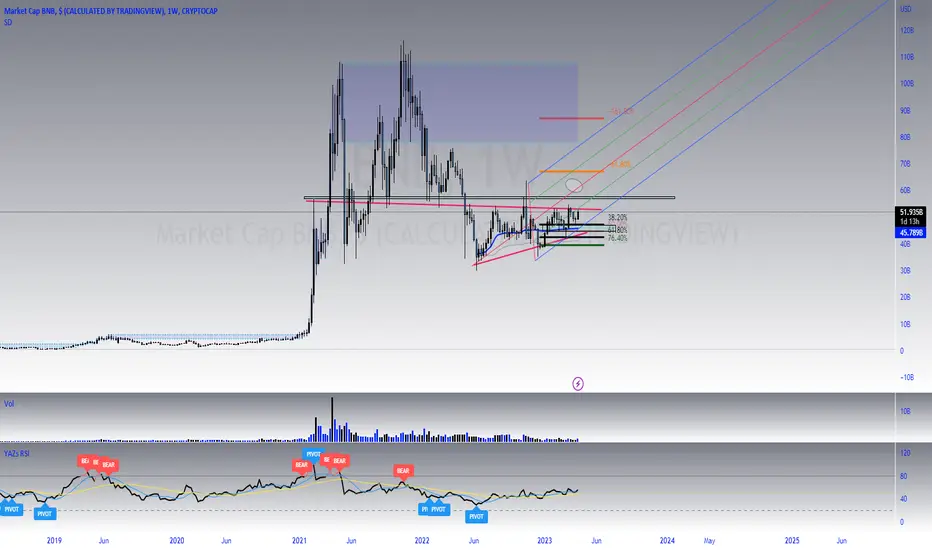
On the chart we can see a symmetrical triangle pattern, which is a neutral pattern meaning that it can breakout either to the upside or to the downside.
Enter the trade once the price breaks out of the triangle.
Look at the volume surge in order to avoid the false breakout.
Targets for long and for short are shown on the chart.
Enter the trade once the price breaks out of the triangle.
Look at the volume surge in order to avoid the false breakout.
Targets for long and for short are shown on the chart.

Clause de non-responsabilité
Les informations et publications ne sont pas destinées à être, et ne constituent pas, des conseils ou recommandations financiers, d'investissement, de trading ou autres fournis ou approuvés par TradingView. Pour en savoir plus, consultez les Conditions d'utilisation.
Clause de non-responsabilité
Les informations et publications ne sont pas destinées à être, et ne constituent pas, des conseils ou recommandations financiers, d'investissement, de trading ou autres fournis ou approuvés par TradingView. Pour en savoir plus, consultez les Conditions d'utilisation.