
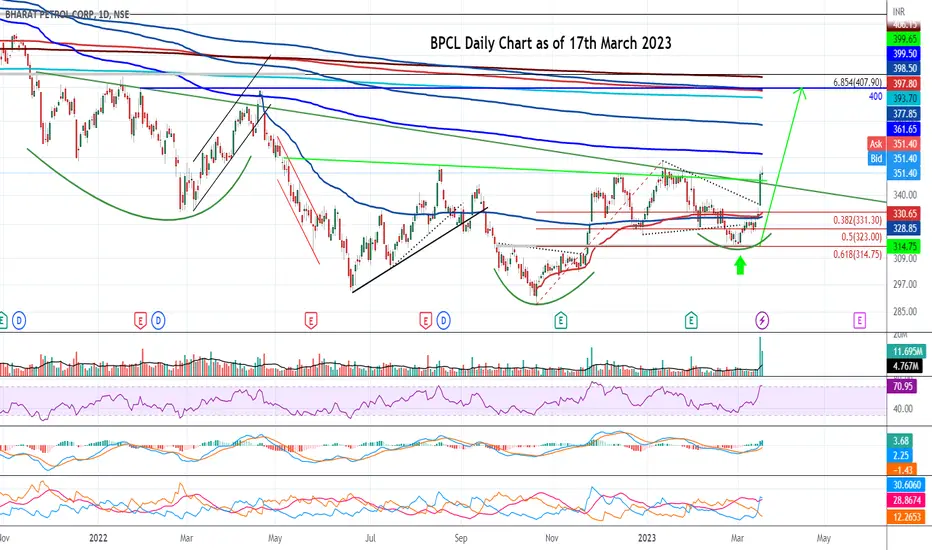
Attached: Daily Chart as of 17th March, 2023
- Price shot up a whooping 6.24% on 16th March (Thursday) and also held the Gains closing Higher on Friday
- Overall giving a Strong Weekly Breakout Candle closing above the 350 key level
- 315 level or the 0.618 Fib retracement held out perfectly as a support🙏
Indicator Signals:
- MACD crossed above 0 line ✅
- RSI crossed above 70 ✅
- DMI gave Buy signal ✅
- ADX is above 25 ✅
- An Inverse Head & Shoulder Pattern is currently active given the Breakout Candle📈
Upside Potential:
A Short Term Target 🎯 of ~ 400 is now Open
Stop Loss for the same is < 325

Siddharth Bhansali
✔️Twitter Handle @T_Harth
✔️Twitter Handle @T_Harth
Clause de non-responsabilité
Les informations et publications ne sont pas destinées à être, et ne constituent pas, des conseils ou recommandations financiers, d'investissement, de trading ou autres fournis ou approuvés par TradingView. Pour en savoir plus, consultez les Conditions d'utilisation.