
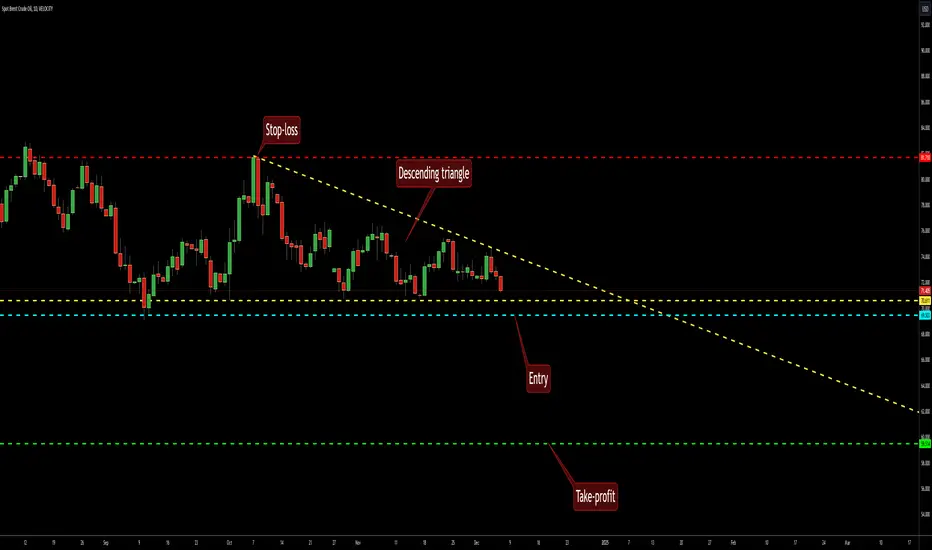
A descending triangle pattern has formed on the daily chart of the spot Brent oil. It follows a long-term downtrend in the oil price and can be used for a bearish breakout setup. The triangle's borders are marked with the yellow lines. The cyan line is where my potential entry level will be. It is located at 10% of the pattern's height below the lower border. The green line denotes my take-profit level. It is set to the 100% of the pattern height plotted below the lower border. I will set the stop-loss level to the triangle's highest point (81.710) - the red line. I will ignore bullish breakouts from this trend continuation pattern.
Ordre annulé
I have cancelled this trade setup as the descending triangle pattern was invalidated.
You can find useful tools to detect, build, and trade chart patterns - all completely free on earnforex.com.
Clause de non-responsabilité
Les informations et publications ne sont pas destinées à être, et ne constituent pas, des conseils ou recommandations financiers, d'investissement, de trading ou autres fournis ou approuvés par TradingView. Pour en savoir plus, consultez les Conditions d'utilisation.
You can find useful tools to detect, build, and trade chart patterns - all completely free on earnforex.com.
Clause de non-responsabilité
Les informations et publications ne sont pas destinées à être, et ne constituent pas, des conseils ou recommandations financiers, d'investissement, de trading ou autres fournis ou approuvés par TradingView. Pour en savoir plus, consultez les Conditions d'utilisation.