
[UPDATE ALTS] We are super early! Look at this crazy CHART!
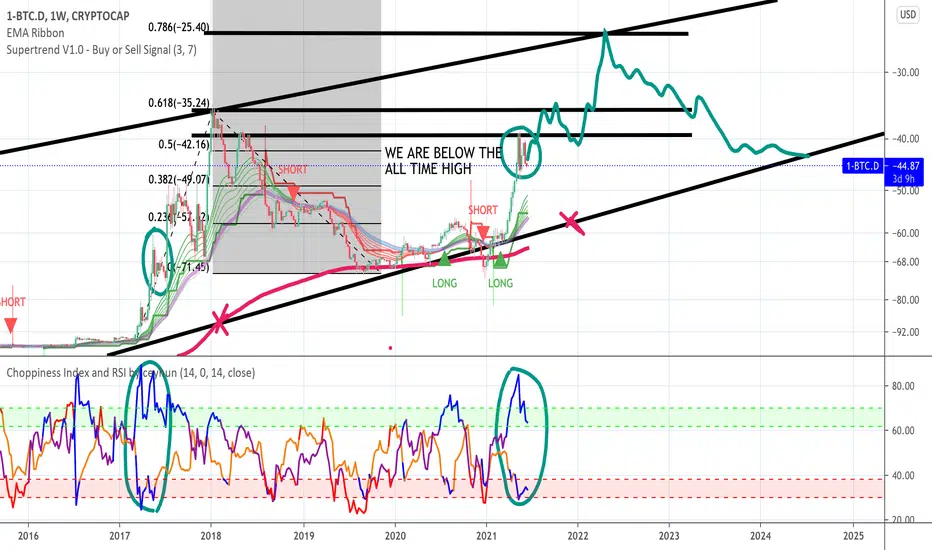
With this analysis, I did the inverse of the BTC dominance. What you are seeing is the inverse BTC dominance.
Isn't this chart bullish per se?
Well,
1) We are below the all-time high of 2018
2) Look at the choppiness index (compare it with the 2017 bull run)
3) Finally, check the 200 weekly EMA (we didn't even cross the log growth curve yet)
To sum up, I see 2 other upcoming pumps for alts and potentially we will ends up in the 22% dominance at the end of the bull cycle.
Isn't this chart bullish per se?
Well,
1) We are below the all-time high of 2018
2) Look at the choppiness index (compare it with the 2017 bull run)
3) Finally, check the 200 weekly EMA (we didn't even cross the log growth curve yet)
To sum up, I see 2 other upcoming pumps for alts and potentially we will ends up in the 22% dominance at the end of the bull cycle.
Note
quick update --> I can see alts starting again to increase over BTC from mid July on.Worst case scenario of the dominance: 49.5
Note
Still here ;)
Note
Note
testing it :) Note
Broken-out Note
Note
Note
Note
Ops it looks like I was right
Publications connexes
Clause de non-responsabilité
Les informations et publications ne sont pas destinées à être, et ne constituent pas, des conseils ou recommandations financiers, d'investissement, de trading ou autres fournis ou approuvés par TradingView. Pour en savoir plus, consultez les Conditions d'utilisation.
Publications connexes
Clause de non-responsabilité
Les informations et publications ne sont pas destinées à être, et ne constituent pas, des conseils ou recommandations financiers, d'investissement, de trading ou autres fournis ou approuvés par TradingView. Pour en savoir plus, consultez les Conditions d'utilisation.