
Please leave a LIKE in order to support my work.
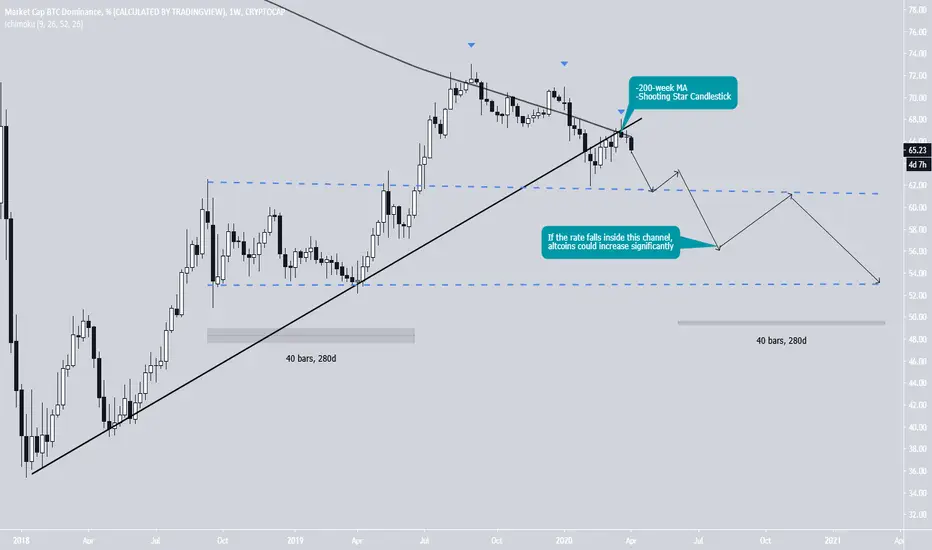
The weekly chart reveals that the price has broken down from a long-term ascending support line and validated it as resistance afterwards. This view is also strengthened by the fact that the rate was rejected by the 200-week MA thrice prior to the price breaking down. The final time, it created a shooting star weekly candlestick, which often indicates a trend reversal. So far, it has created three consecutive lower highs.
The most important support level is at 62.5%, which mark the wick low of Feb 10-17. If the rate decreases below it, it could fall all the way to 52.5%, levels not seen since April 2019.
Previously, the rate traded inside this range from September 2018 to April 2019, a period which was very profitable for altcoins. If the price falls within this range once more, it is possible that it would have a similar effect.
The weekly chart reveals that the price has broken down from a long-term ascending support line and validated it as resistance afterwards. This view is also strengthened by the fact that the rate was rejected by the 200-week MA thrice prior to the price breaking down. The final time, it created a shooting star weekly candlestick, which often indicates a trend reversal. So far, it has created three consecutive lower highs.
The most important support level is at 62.5%, which mark the wick low of Feb 10-17. If the rate decreases below it, it could fall all the way to 52.5%, levels not seen since April 2019.
Previously, the rate traded inside this range from September 2018 to April 2019, a period which was very profitable for altcoins. If the price falls within this range once more, it is possible that it would have a similar effect.

Clause de non-responsabilité
Les informations et publications ne sont pas destinées à être, et ne constituent pas, des conseils ou recommandations financiers, d'investissement, de trading ou autres fournis ou approuvés par TradingView. Pour en savoir plus, consultez les Conditions d'utilisation.
Clause de non-responsabilité
Les informations et publications ne sont pas destinées à être, et ne constituent pas, des conseils ou recommandations financiers, d'investissement, de trading ou autres fournis ou approuvés par TradingView. Pour en savoir plus, consultez les Conditions d'utilisation.