
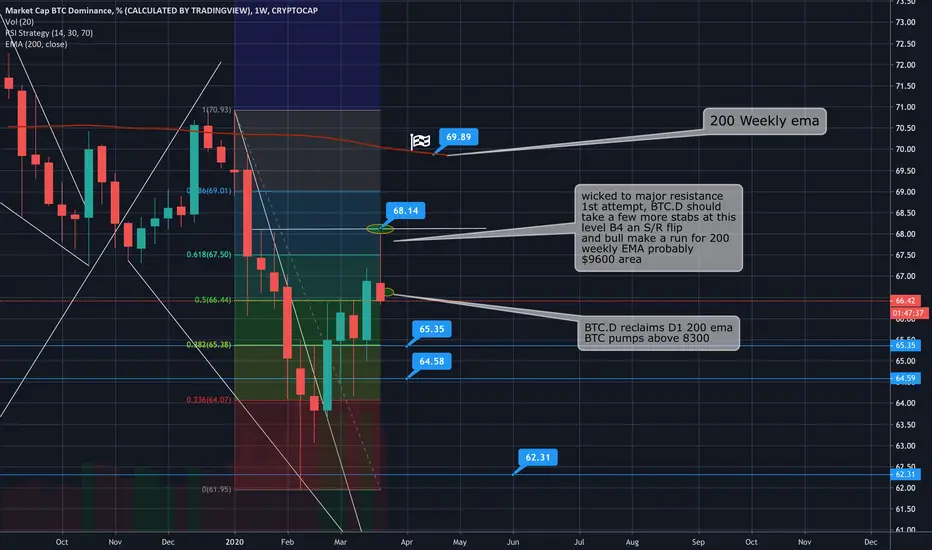
Cleaned up the BTC.D chart, as I feel now that bitcoin dominance is in a consolidation phase along side BTC price action. The D1 BTC.D chart has a falling wedge that is right below the 200 ema.
I am almost 99% certain it will break up leading to another pump in dom & price of bitcoin.
68% will most likely take a few attempts B4 finally failing as BTC breaks up along with dom & heading towards the 200 ema weekly chart.
There is some room for downside here to $5,500 level but thats really all I see and will probably be a great buy for a TP of $9600 next major area of resistance.
I am almost 99% certain it will break up leading to another pump in dom & price of bitcoin.
68% will most likely take a few attempts B4 finally failing as BTC breaks up along with dom & heading towards the 200 ema weekly chart.
There is some room for downside here to $5,500 level but thats really all I see and will probably be a great buy for a TP of $9600 next major area of resistance.

If your interested in joining my group DM me for the link. We do Elliot Wave TA give trade signals and set ups. We have channels for all cryptocurrency and also many OTC stocks. TY
Clause de non-responsabilité
Les informations et publications ne sont pas destinées à être, et ne constituent pas, des conseils ou recommandations financiers, d'investissement, de trading ou autres fournis ou approuvés par TradingView. Pour en savoir plus, consultez les Conditions d'utilisation.
If your interested in joining my group DM me for the link. We do Elliot Wave TA give trade signals and set ups. We have channels for all cryptocurrency and also many OTC stocks. TY
Clause de non-responsabilité
Les informations et publications ne sont pas destinées à être, et ne constituent pas, des conseils ou recommandations financiers, d'investissement, de trading ou autres fournis ou approuvés par TradingView. Pour en savoir plus, consultez les Conditions d'utilisation.