
Take a step back from the daily chop and look at the bigger picture. We often talk about bottoming setups, but real market patterns are rarely neat and pretty. What matters is where real buying pressure shows up and where sellers run out of room.
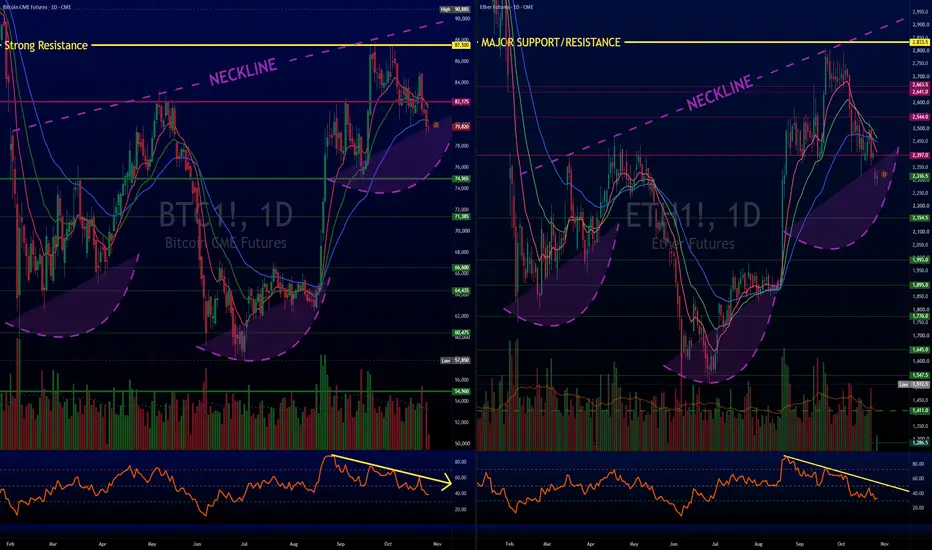
Right now, both Bitcoin and Ether futures look like they are forming a giant bottom base that stretches all the way back to early this year.
The Three Step Bottom
The Left Base: The chop between February and April.
The Deep Flush: The big summer drop down to the mid 50k zone on Bitcoin and 1.6k on Ether that wiped out leverage.
The Right Side Build: The strong bounce off the August lows that is refusing to pull back.
Here is the interesting twist!
Instead of a flat trigger line across the top, (we highlighted the old Inverse Head & Shoulder before on older posts), we have an upward sloping line linking the previous peaks.
Usually, an upward sloping trigger line makes traders nervous because the price has to run very far just to break out. HOWEVER, look at where that angled line lands on the chart.
It crashes right into the exact same spot as the massive multi month ceiling:
Bitcoin: The heavy 87k to 88k zone.
Ether: The critical 2.8k level.
Why This Double Barrier Matters!
When an angled trendline and a major flat ceiling meet at the very same price, you get a double barrier. Sellers who want to short the flat roof and breakout traders watching the angled line are staring at the exact same level. If price pushes through, both groups get squeezed into buying at the same time. That is often what fuels a VIOLENT move higher.
Look at how the right side is acting. Price is not sliding back down toward the summer lows. It is hovering near the highs, soaking up selling right under the ceiling, and holding above key daily moving averages.
What to Watch For
Bulls want Bitcoin to stay above the 75k shelf on pullbacks, while Ether holds above 2150.
Daily momentum has cooled off after the recent push, meaning patience is required while this base digests.
The true green light only comes on a solid daily candle close above 88k on Bitcoin and 2.8k on Ether with heavy volume backing it up.
Until that ceiling clears, respect the boundaries of the range. Once it breaks, the target of this entire macro base opens the door to fresh highs.
Extra:
We are keeping an eye on intraday volume. We start seeing heavier than normal volume we will follow. We will likely rebuy the spot portions we sold and leveraged ETF's.
TGtg!
Right now, both Bitcoin and Ether futures look like they are forming a giant bottom base that stretches all the way back to early this year.
The Three Step Bottom
The Left Base: The chop between February and April.
The Deep Flush: The big summer drop down to the mid 50k zone on Bitcoin and 1.6k on Ether that wiped out leverage.
The Right Side Build: The strong bounce off the August lows that is refusing to pull back.
Here is the interesting twist!
Instead of a flat trigger line across the top, (we highlighted the old Inverse Head & Shoulder before on older posts), we have an upward sloping line linking the previous peaks.
Usually, an upward sloping trigger line makes traders nervous because the price has to run very far just to break out. HOWEVER, look at where that angled line lands on the chart.
It crashes right into the exact same spot as the massive multi month ceiling:
Bitcoin: The heavy 87k to 88k zone.
Ether: The critical 2.8k level.
Why This Double Barrier Matters!
When an angled trendline and a major flat ceiling meet at the very same price, you get a double barrier. Sellers who want to short the flat roof and breakout traders watching the angled line are staring at the exact same level. If price pushes through, both groups get squeezed into buying at the same time. That is often what fuels a VIOLENT move higher.
Look at how the right side is acting. Price is not sliding back down toward the summer lows. It is hovering near the highs, soaking up selling right under the ceiling, and holding above key daily moving averages.
What to Watch For
Bulls want Bitcoin to stay above the 75k shelf on pullbacks, while Ether holds above 2150.
Daily momentum has cooled off after the recent push, meaning patience is required while this base digests.
The true green light only comes on a solid daily candle close above 88k on Bitcoin and 2.8k on Ether with heavy volume backing it up.
Until that ceiling clears, respect the boundaries of the range. Once it breaks, the target of this entire macro base opens the door to fresh highs.
Extra:
We are keeping an eye on intraday volume. We start seeing heavier than normal volume we will follow. We will likely rebuy the spot portions we sold and leveraged ETF's.
TGtg!

Publications connexes
Clause de non-responsabilité
Les informations et publications ne sont pas destinées à être, et ne constituent pas, des conseils ou recommandations financiers, d'investissement, de trading ou autres fournis ou approuvés par TradingView. Pour en savoir plus, consultez les Conditions d'utilisation.
Publications connexes
Clause de non-responsabilité
Les informations et publications ne sont pas destinées à être, et ne constituent pas, des conseils ou recommandations financiers, d'investissement, de trading ou autres fournis ou approuvés par TradingView. Pour en savoir plus, consultez les Conditions d'utilisation.