
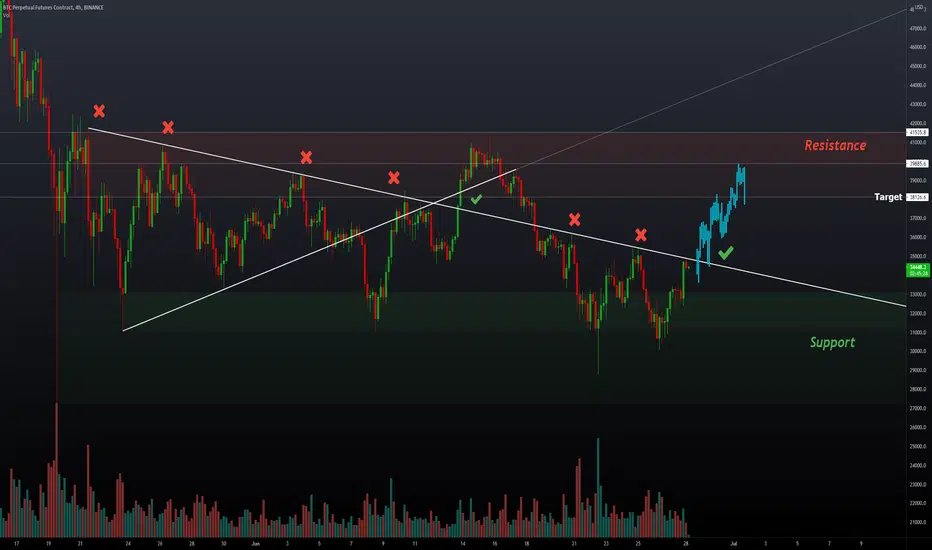
Just a quick chart, as you can see the downtrend line from the previous Symmetrical Triangle is pretty important if price can find support above this area marked with a green tick its likely BTC Heads up to the marked Resistance area.
Note
Note
Under the resistance again on this, might have to re draw the X haha
Clause de non-responsabilité
Les informations et publications ne sont pas destinées à être, et ne constituent pas, des conseils ou recommandations financiers, d'investissement, de trading ou autres fournis ou approuvés par TradingView. Pour en savoir plus, consultez les Conditions d'utilisation.
Clause de non-responsabilité
Les informations et publications ne sont pas destinées à être, et ne constituent pas, des conseils ou recommandations financiers, d'investissement, de trading ou autres fournis ou approuvés par TradingView. Pour en savoir plus, consultez les Conditions d'utilisation.