
BTC/USDT – Weekly Chart Update
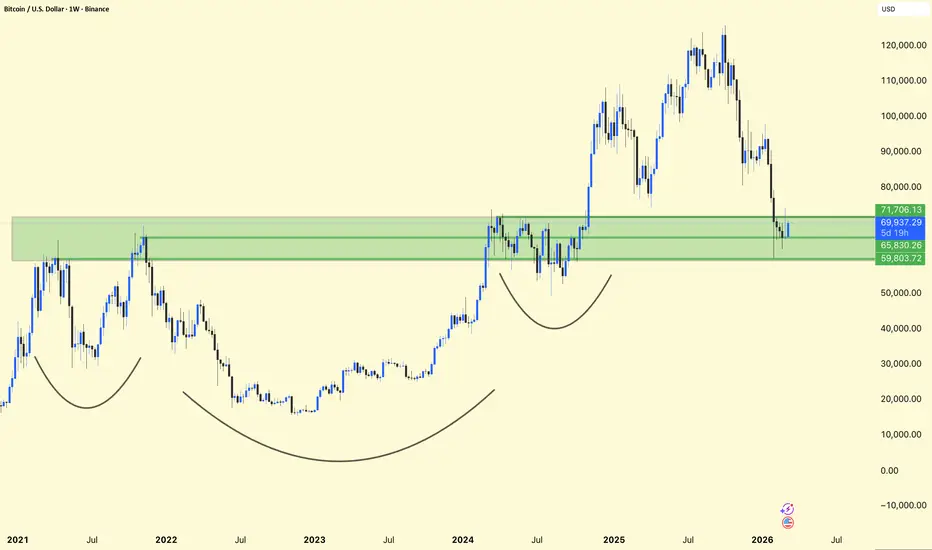
Bitcoin is currently testing a major weekly demand zone between $59K – $71K after the recent sharp correction from the highs.
Price has returned to a previous breakout and accumulation area.
This green zone acted as strong resistance in the past and is now acting as support.
The structure still resembles a large cup-type formation on the higher timeframe, suggesting long-term bullish potential if support holds.
Bullish Scenario:
Holding above $65K–$60K support could trigger a recovery.
A reclaim of $71K resistance may open the path toward $85K–$100K again.
Bearish Scenario:
If $59K support breaks, the next deeper correction zone could appear around $50K–$52K.
BTC is currently retesting a critical weekly support zone. The reaction here will likely determine whether the market continues the macro uptrend or enters a deeper correction phase.
Bitcoin is currently testing a major weekly demand zone between $59K – $71K after the recent sharp correction from the highs.
Price has returned to a previous breakout and accumulation area.
This green zone acted as strong resistance in the past and is now acting as support.
The structure still resembles a large cup-type formation on the higher timeframe, suggesting long-term bullish potential if support holds.
Bullish Scenario:
Holding above $65K–$60K support could trigger a recovery.
A reclaim of $71K resistance may open the path toward $85K–$100K again.
Bearish Scenario:
If $59K support breaks, the next deeper correction zone could appear around $50K–$52K.
BTC is currently retesting a critical weekly support zone. The reaction here will likely determine whether the market continues the macro uptrend or enters a deeper correction phase.

Publications connexes
Clause de non-responsabilité
Les informations et publications ne sont pas destinées à être, et ne constituent pas, des conseils ou recommandations financiers, d'investissement, de trading ou autres fournis ou approuvés par TradingView. Pour en savoir plus, consultez les Conditions d'utilisation.
Publications connexes
Clause de non-responsabilité
Les informations et publications ne sont pas destinées à être, et ne constituent pas, des conseils ou recommandations financiers, d'investissement, de trading ou autres fournis ou approuvés par TradingView. Pour en savoir plus, consultez les Conditions d'utilisation.