
Technical Analysis and Outlook:
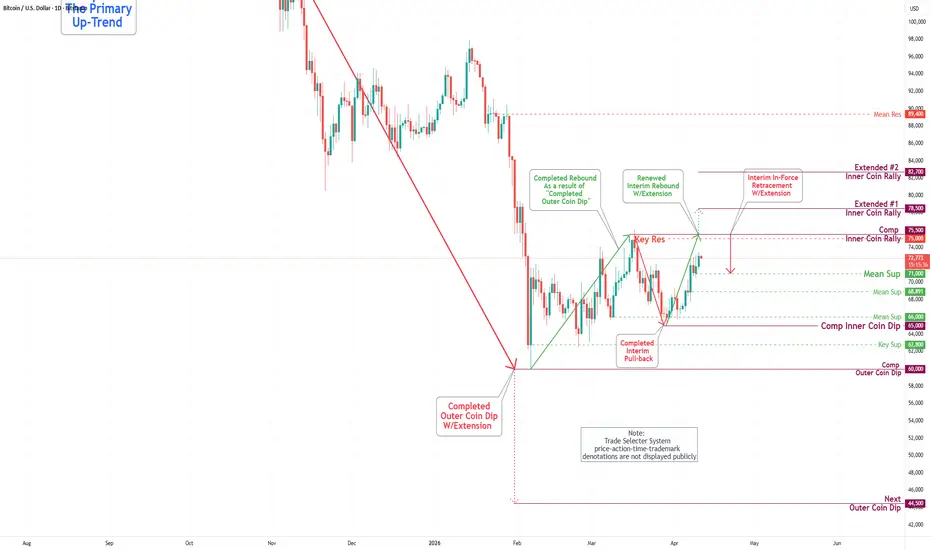
Recently, Bitcoin prices broke out of the Active Inner Trading Zone, moving past the Mean Resistance levels of 68,900 and 71,200. The focus is now on Key Resistance at 74,900, with a potential retest of the Inner Coin Rally at 75,500.
Advanced market analysis indicates a potential for further price increases, reaching the extended #1 Inner Coin Rally at 78,500, and ultimately progressing to the critical extended #2 Inner Coin Rally at 82,700.
Conversely, there is potential for a gradual decline toward the Mean Support level at 71,000 before any upward movement toward the initial targets will take place However, should market conditions deteriorate, resulting in a decline to the Mean Support at 71,000, an Interim In-Force Retracement will be initiated after achieving the initial price targets or from the extended #1 Inner Coin Rally at 78,500 or the extended #2 Inner Coin Rally at 82,700.
Recently, Bitcoin prices broke out of the Active Inner Trading Zone, moving past the Mean Resistance levels of 68,900 and 71,200. The focus is now on Key Resistance at 74,900, with a potential retest of the Inner Coin Rally at 75,500.
Advanced market analysis indicates a potential for further price increases, reaching the extended #1 Inner Coin Rally at 78,500, and ultimately progressing to the critical extended #2 Inner Coin Rally at 82,700.
Conversely, there is potential for a gradual decline toward the Mean Support level at 71,000 before any upward movement toward the initial targets will take place However, should market conditions deteriorate, resulting in a decline to the Mean Support at 71,000, an Interim In-Force Retracement will be initiated after achieving the initial price targets or from the extended #1 Inner Coin Rally at 78,500 or the extended #2 Inner Coin Rally at 82,700.

Publications connexes
Clause de non-responsabilité
Les informations et publications ne sont pas destinées à être, et ne constituent pas, des conseils ou recommandations financiers, d'investissement, de trading ou autres fournis ou approuvés par TradingView. Pour en savoir plus, consultez les Conditions d'utilisation.
Publications connexes
Clause de non-responsabilité
Les informations et publications ne sont pas destinées à être, et ne constituent pas, des conseils ou recommandations financiers, d'investissement, de trading ou autres fournis ou approuvés par TradingView. Pour en savoir plus, consultez les Conditions d'utilisation.