
📈Introduction
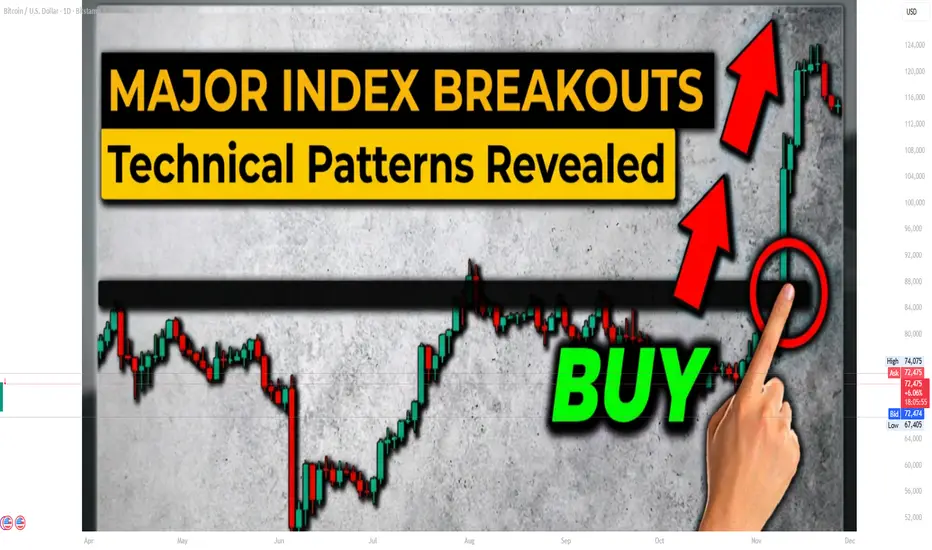
In financial markets, major index breakout patterns are among the most powerful signals used by traders and investors. A breakout occurs when the price of a major market index moves beyond a defined support or resistance level with strong momentum and increased trading volume. Such movements often signal the beginning of a new trend and attract both institutional and retail traders. Major indices like the S&P 500, Dow Jones Industrial Average, NASDAQ Composite, and India’s Nifty 50 frequently exhibit these breakout patterns, which can provide valuable trading opportunities.
Understanding breakout patterns requires knowledge of technical analysis, market psychology, and trading volume dynamics. When an index breaks through a critical level, it often indicates that the balance between buyers and sellers has shifted significantly.
What Is a Breakout in Technical Analysis?
A breakout occurs when the price moves above resistance or below support. Resistance is a level where selling pressure historically prevents the price from rising further, while support is a level where buying pressure prevents the price from falling.
When a breakout happens:
Bullish breakout: Price moves above resistance.
Bearish breakout: Price falls below support.
For example, if the Nifty 50 repeatedly struggles to move above a particular level and finally breaks above it with strong volume, traders interpret this as a bullish signal.
Breakouts are powerful because they indicate a shift in market sentiment. Traders who previously sold at resistance may begin buying once that level is broken.
Why Breakouts Matter in Major Indices
Major indices represent the overall health of the market. When indices break out of key levels, it can trigger large-scale capital flows from institutions such as mutual funds, hedge funds, and pension funds.
For example:
A breakout in the S&P 500 can influence global markets.
A breakout in the Nifty 50 can trigger momentum across Indian equities.
Because indices contain multiple stocks, their breakout patterns are considered more reliable than those of individual stocks.
Key Breakout Technical Patterns
Several chart patterns commonly lead to breakouts in major indices.
1. Ascending Triangle Breakout
The ascending triangle is a bullish continuation pattern.
Characteristics:
A horizontal resistance level
A series of higher lows
This pattern shows that buyers are gradually gaining strength while sellers defend a fixed level. Eventually, buying pressure overwhelms sellers, leading to a breakout.
In indices like the NASDAQ Composite, ascending triangles often appear during strong bull markets.
Once the breakout occurs, traders usually expect a sharp upward movement.
2. Descending Triangle Breakout
A descending triangle is generally a bearish pattern.
Features include:
A horizontal support level
Lower highs
This indicates increasing selling pressure. Eventually, the support breaks, and the index may decline sharply.
This pattern often appears during market corrections or bearish phases.
3. Symmetrical Triangle Breakout
The symmetrical triangle represents market indecision.
Characteristics:
Lower highs
Higher lows
Converging trendlines
This pattern can break in either direction. When the breakout occurs, the move is usually strong because volatility had been contracting.
Indices like the Dow Jones Industrial Average frequently show this pattern during consolidation phases.
4. Cup and Handle Breakout
The cup and handle is a classic bullish breakout pattern.
Structure:
A rounded bottom (cup)
A small consolidation (handle)
Breakout above resistance
This pattern reflects a gradual shift from selling pressure to strong buying demand.
When the breakout occurs, it often leads to long-term bullish trends.
5. Rectangle Breakout
A rectangle pattern forms when price moves sideways between support and resistance.
This represents a consolidation phase where buyers and sellers are balanced.
Eventually, the index breaks out of the range.
Break above resistance → bullish breakout
Break below support → bearish breakout
These patterns frequently appear before major market moves.
Role of Volume in Breakouts
Volume plays a critical role in confirming breakout patterns.
A valid breakout typically occurs with:
High trading volume
Strong price momentum
Wide price candles
If a breakout happens with low volume, it may result in a false breakout or “fakeout.”
Institutional traders watch volume carefully before entering trades.
False Breakouts and Market Traps
Not all breakouts are reliable. Sometimes markets create false breakouts to trap traders.
Common signs of false breakouts:
Price quickly returns inside the pattern.
Low trading volume.
Lack of follow-through momentum.
For example, an index might break resistance briefly but then fall back below the level.
Professional traders often wait for confirmation before entering trades.
Breakout Confirmation Techniques
Traders use several techniques to confirm breakouts.
1. Retest of Breakout Level
After breaking resistance, price may return to test the level.
If the level holds as support, it confirms the breakout.
2. Moving Average Support
Breakouts that occur above major moving averages such as:
50-day moving average
200-day moving average
are considered stronger signals.
3. Momentum Indicators
Indicators like:
RSI
MACD
Volume Oscillator
can help confirm breakout strength.
For example, if RSI rises above 60 during a breakout, it indicates strong bullish momentum.
Institutional Influence on Index Breakouts
Large financial institutions often drive index breakouts.
These players include:
Hedge funds
Investment banks
Pension funds
Algorithmic trading firms
Because they trade large volumes, their actions can push indices beyond major resistance levels.
Once the breakout occurs, momentum traders join the trend, further accelerating the move.
Psychological Factors Behind Breakouts
Market psychology plays a major role in breakout patterns.
When an index approaches resistance:
Some traders sell to take profits.
Others wait for confirmation.
When resistance finally breaks:
Short sellers cover positions.
Momentum traders buy aggressively.
This combination leads to explosive price movements.
Breakouts and Market Cycles
Breakouts often mark important phases in market cycles.
Typical sequence:
Accumulation phase – institutions quietly buy.
Consolidation phase – index moves sideways.
Breakout phase – strong upward momentum begins.
Trend expansion – market rallies significantly.
Understanding this cycle helps traders position themselves early.
Risk Management in Breakout Trading
Even strong breakout patterns carry risk.
Key risk management techniques include:
Using stop-loss orders
Waiting for confirmation candles
Avoiding trades during low volume
Traders often place stop-loss levels below the breakout point.
This helps limit losses if the breakout fails.
Conclusion
Major index breakout technical patterns provide valuable insights into market trends and momentum. By analyzing patterns such as ascending triangles, symmetrical triangles, rectangles, and cup-and-handle formations, traders can anticipate significant market movements.
Indices like the S&P 500, NASDAQ Composite, Dow Jones Industrial Average, and Nifty 50 often display these patterns before major rallies or corrections. However, successful breakout trading requires careful attention to volume, momentum indicators, and risk management.
By combining technical analysis with an understanding of market psychology and institutional behavior, traders can better identify genuine breakouts and avoid false signals. Ultimately, mastering breakout patterns can significantly enhance trading strategies and improve decision-making in dynamic financial markets. 📊
In financial markets, major index breakout patterns are among the most powerful signals used by traders and investors. A breakout occurs when the price of a major market index moves beyond a defined support or resistance level with strong momentum and increased trading volume. Such movements often signal the beginning of a new trend and attract both institutional and retail traders. Major indices like the S&P 500, Dow Jones Industrial Average, NASDAQ Composite, and India’s Nifty 50 frequently exhibit these breakout patterns, which can provide valuable trading opportunities.
Understanding breakout patterns requires knowledge of technical analysis, market psychology, and trading volume dynamics. When an index breaks through a critical level, it often indicates that the balance between buyers and sellers has shifted significantly.
What Is a Breakout in Technical Analysis?
A breakout occurs when the price moves above resistance or below support. Resistance is a level where selling pressure historically prevents the price from rising further, while support is a level where buying pressure prevents the price from falling.
When a breakout happens:
Bullish breakout: Price moves above resistance.
Bearish breakout: Price falls below support.
For example, if the Nifty 50 repeatedly struggles to move above a particular level and finally breaks above it with strong volume, traders interpret this as a bullish signal.
Breakouts are powerful because they indicate a shift in market sentiment. Traders who previously sold at resistance may begin buying once that level is broken.
Why Breakouts Matter in Major Indices
Major indices represent the overall health of the market. When indices break out of key levels, it can trigger large-scale capital flows from institutions such as mutual funds, hedge funds, and pension funds.
For example:
A breakout in the S&P 500 can influence global markets.
A breakout in the Nifty 50 can trigger momentum across Indian equities.
Because indices contain multiple stocks, their breakout patterns are considered more reliable than those of individual stocks.
Key Breakout Technical Patterns
Several chart patterns commonly lead to breakouts in major indices.
1. Ascending Triangle Breakout
The ascending triangle is a bullish continuation pattern.
Characteristics:
A horizontal resistance level
A series of higher lows
This pattern shows that buyers are gradually gaining strength while sellers defend a fixed level. Eventually, buying pressure overwhelms sellers, leading to a breakout.
In indices like the NASDAQ Composite, ascending triangles often appear during strong bull markets.
Once the breakout occurs, traders usually expect a sharp upward movement.
2. Descending Triangle Breakout
A descending triangle is generally a bearish pattern.
Features include:
A horizontal support level
Lower highs
This indicates increasing selling pressure. Eventually, the support breaks, and the index may decline sharply.
This pattern often appears during market corrections or bearish phases.
3. Symmetrical Triangle Breakout
The symmetrical triangle represents market indecision.
Characteristics:
Lower highs
Higher lows
Converging trendlines
This pattern can break in either direction. When the breakout occurs, the move is usually strong because volatility had been contracting.
Indices like the Dow Jones Industrial Average frequently show this pattern during consolidation phases.
4. Cup and Handle Breakout
The cup and handle is a classic bullish breakout pattern.
Structure:
A rounded bottom (cup)
A small consolidation (handle)
Breakout above resistance
This pattern reflects a gradual shift from selling pressure to strong buying demand.
When the breakout occurs, it often leads to long-term bullish trends.
5. Rectangle Breakout
A rectangle pattern forms when price moves sideways between support and resistance.
This represents a consolidation phase where buyers and sellers are balanced.
Eventually, the index breaks out of the range.
Break above resistance → bullish breakout
Break below support → bearish breakout
These patterns frequently appear before major market moves.
Role of Volume in Breakouts
Volume plays a critical role in confirming breakout patterns.
A valid breakout typically occurs with:
High trading volume
Strong price momentum
Wide price candles
If a breakout happens with low volume, it may result in a false breakout or “fakeout.”
Institutional traders watch volume carefully before entering trades.
False Breakouts and Market Traps
Not all breakouts are reliable. Sometimes markets create false breakouts to trap traders.
Common signs of false breakouts:
Price quickly returns inside the pattern.
Low trading volume.
Lack of follow-through momentum.
For example, an index might break resistance briefly but then fall back below the level.
Professional traders often wait for confirmation before entering trades.
Breakout Confirmation Techniques
Traders use several techniques to confirm breakouts.
1. Retest of Breakout Level
After breaking resistance, price may return to test the level.
If the level holds as support, it confirms the breakout.
2. Moving Average Support
Breakouts that occur above major moving averages such as:
50-day moving average
200-day moving average
are considered stronger signals.
3. Momentum Indicators
Indicators like:
RSI
MACD
Volume Oscillator
can help confirm breakout strength.
For example, if RSI rises above 60 during a breakout, it indicates strong bullish momentum.
Institutional Influence on Index Breakouts
Large financial institutions often drive index breakouts.
These players include:
Hedge funds
Investment banks
Pension funds
Algorithmic trading firms
Because they trade large volumes, their actions can push indices beyond major resistance levels.
Once the breakout occurs, momentum traders join the trend, further accelerating the move.
Psychological Factors Behind Breakouts
Market psychology plays a major role in breakout patterns.
When an index approaches resistance:
Some traders sell to take profits.
Others wait for confirmation.
When resistance finally breaks:
Short sellers cover positions.
Momentum traders buy aggressively.
This combination leads to explosive price movements.
Breakouts and Market Cycles
Breakouts often mark important phases in market cycles.
Typical sequence:
Accumulation phase – institutions quietly buy.
Consolidation phase – index moves sideways.
Breakout phase – strong upward momentum begins.
Trend expansion – market rallies significantly.
Understanding this cycle helps traders position themselves early.
Risk Management in Breakout Trading
Even strong breakout patterns carry risk.
Key risk management techniques include:
Using stop-loss orders
Waiting for confirmation candles
Avoiding trades during low volume
Traders often place stop-loss levels below the breakout point.
This helps limit losses if the breakout fails.
Conclusion
Major index breakout technical patterns provide valuable insights into market trends and momentum. By analyzing patterns such as ascending triangles, symmetrical triangles, rectangles, and cup-and-handle formations, traders can anticipate significant market movements.
Indices like the S&P 500, NASDAQ Composite, Dow Jones Industrial Average, and Nifty 50 often display these patterns before major rallies or corrections. However, successful breakout trading requires careful attention to volume, momentum indicators, and risk management.
By combining technical analysis with an understanding of market psychology and institutional behavior, traders can better identify genuine breakouts and avoid false signals. Ultimately, mastering breakout patterns can significantly enhance trading strategies and improve decision-making in dynamic financial markets. 📊

Hye Guys,Welcome to a professional trading journey built on precision, discipline, and smart money concepts.
📞 Phone: +91 93159 78955
💬 WhatsApp: wa.link/kdkejz
📩 Contact Mail: globalwolfstreet@gmail.com
📞 Phone: +91 93159 78955
💬 WhatsApp: wa.link/kdkejz
📩 Contact Mail: globalwolfstreet@gmail.com
Publications connexes
Clause de non-responsabilité
Les informations et publications ne sont pas destinées à être, et ne constituent pas, des conseils ou recommandations financiers, d'investissement, de trading ou autres fournis ou approuvés par TradingView. Pour en savoir plus, consultez les Conditions d'utilisation.
Hye Guys,Welcome to a professional trading journey built on precision, discipline, and smart money concepts.
📞 Phone: +91 93159 78955
💬 WhatsApp: wa.link/kdkejz
📩 Contact Mail: globalwolfstreet@gmail.com
📞 Phone: +91 93159 78955
💬 WhatsApp: wa.link/kdkejz
📩 Contact Mail: globalwolfstreet@gmail.com
Publications connexes
Clause de non-responsabilité
Les informations et publications ne sont pas destinées à être, et ne constituent pas, des conseils ou recommandations financiers, d'investissement, de trading ou autres fournis ou approuvés par TradingView. Pour en savoir plus, consultez les Conditions d'utilisation.