
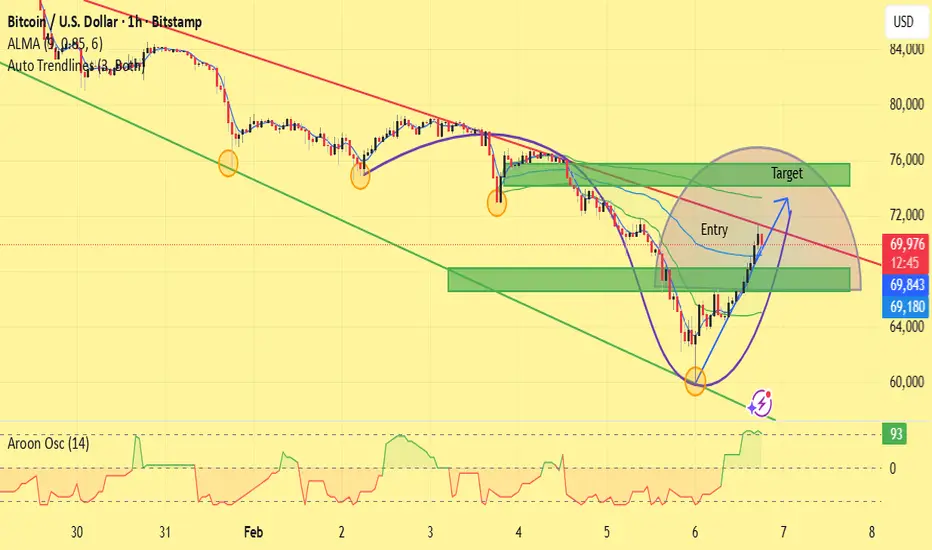
Bitcoin is trading within a broader descending channel, but recent price action shows a strong bullish reaction from channel support, suggesting a potential short-term recovery.
Technical Analysis
Price respected the lower trendline support of the descending channel and formed a rounded bottom / V-shaped recovery, indicating exhaustion of sellers.
A bullish structure shift is visible after the strong bounce from the lows, with higher highs and higher lows on the lower timeframe.
The green demand zone has acted as a solid support area, from which price is pushing upward.
The red descending trendline above is a key resistance and confluence area.
ALMA and dynamic levels suggest price is attempting a corrective move within the overall downtrend.
Aroon Oscillator is strongly bullish, confirming increasing upside momentum.
Trade Idea
Entry: Buy on pullback / confirmation within the marked green support zone.
Target: Upper resistance zone near the descending trendline (marked “Target”).
Bias: Short-term bullish correction, long-term trend still bearish unless price breaks and holds above the descending trendline.
Invalidation: A strong close below the demand zone and channel support.
Conclusion
This setup favors a counter-trend bullish move toward resistance. Traders should manage risk carefully, as the overall market structure remains bearish until a confirmed breakout occurs.
This analysis is for educational purposes only and not financial advice.
Technical Analysis
Price respected the lower trendline support of the descending channel and formed a rounded bottom / V-shaped recovery, indicating exhaustion of sellers.
A bullish structure shift is visible after the strong bounce from the lows, with higher highs and higher lows on the lower timeframe.
The green demand zone has acted as a solid support area, from which price is pushing upward.
The red descending trendline above is a key resistance and confluence area.
ALMA and dynamic levels suggest price is attempting a corrective move within the overall downtrend.
Aroon Oscillator is strongly bullish, confirming increasing upside momentum.
Trade Idea
Entry: Buy on pullback / confirmation within the marked green support zone.
Target: Upper resistance zone near the descending trendline (marked “Target”).
Bias: Short-term bullish correction, long-term trend still bearish unless price breaks and holds above the descending trendline.
Invalidation: A strong close below the demand zone and channel support.
Conclusion
This setup favors a counter-trend bullish move toward resistance. Traders should manage risk carefully, as the overall market structure remains bearish until a confirmed breakout occurs.
This analysis is for educational purposes only and not financial advice.
Transaction en cours

t.me/wolfpipsspot
Sharing My Exprience Here And providing Daily Forex Ideas t.me/wolfpipsspot Free Signal's Analysis Chart Mapping
Don't Worry Friend's I'm Here For Your Help ❤️ t.me/wolfpipsspot
Sharing My Exprience Here And providing Daily Forex Ideas t.me/wolfpipsspot Free Signal's Analysis Chart Mapping
Don't Worry Friend's I'm Here For Your Help ❤️ t.me/wolfpipsspot
Clause de non-responsabilité
Les informations et publications ne sont pas destinées à être, et ne constituent pas, des conseils ou recommandations financiers, d'investissement, de trading ou autres fournis ou approuvés par TradingView. Pour en savoir plus, consultez les Conditions d'utilisation.
t.me/wolfpipsspot
Sharing My Exprience Here And providing Daily Forex Ideas t.me/wolfpipsspot Free Signal's Analysis Chart Mapping
Don't Worry Friend's I'm Here For Your Help ❤️ t.me/wolfpipsspot
Sharing My Exprience Here And providing Daily Forex Ideas t.me/wolfpipsspot Free Signal's Analysis Chart Mapping
Don't Worry Friend's I'm Here For Your Help ❤️ t.me/wolfpipsspot
Clause de non-responsabilité
Les informations et publications ne sont pas destinées à être, et ne constituent pas, des conseils ou recommandations financiers, d'investissement, de trading ou autres fournis ou approuvés par TradingView. Pour en savoir plus, consultez les Conditions d'utilisation.