
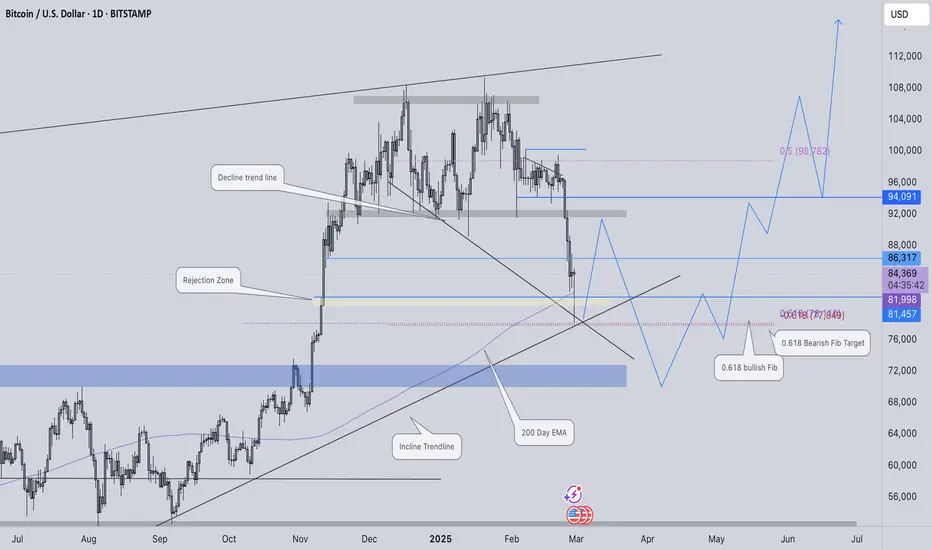
Over the past seven days, Bitcoin experienced a significant decline, dropping 2,440 pips before finding support around the 78,261 level. This area acted as a key zone of interest due to multiple technical confluences aligning, ultimately halting further downside movement. As a result, we are now witnessing a reaction at this level.
Looking ahead, I anticipate two potential scenarios. Bitcoin could revisit this support level, forming a double-bottom structure before initiating an upward push toward 91,500. Alternatively, it may first rally toward 91,500 before facing a rejection, leading to a corrective move down to approximately 71,500. If this pullback materializes and establishes a strong base, I expect Bitcoin to gain bullish momentum, eventually setting a new all-time high in the coming months.
Daily Chart Total Crypto Cap
There were multiple confluences to see an reaction at 2.6T.

Looking ahead, I anticipate two potential scenarios. Bitcoin could revisit this support level, forming a double-bottom structure before initiating an upward push toward 91,500. Alternatively, it may first rally toward 91,500 before facing a rejection, leading to a corrective move down to approximately 71,500. If this pullback materializes and establishes a strong base, I expect Bitcoin to gain bullish momentum, eventually setting a new all-time high in the coming months.
Daily Chart Total Crypto Cap
There were multiple confluences to see an reaction at 2.6T.

Clause de non-responsabilité
Les informations et publications ne sont pas destinées à être, et ne constituent pas, des conseils ou recommandations financiers, d'investissement, de trading ou autres fournis ou approuvés par TradingView. Pour en savoir plus, consultez les Conditions d'utilisation.
Clause de non-responsabilité
Les informations et publications ne sont pas destinées à être, et ne constituent pas, des conseils ou recommandations financiers, d'investissement, de trading ou autres fournis ou approuvés par TradingView. Pour en savoir plus, consultez les Conditions d'utilisation.