
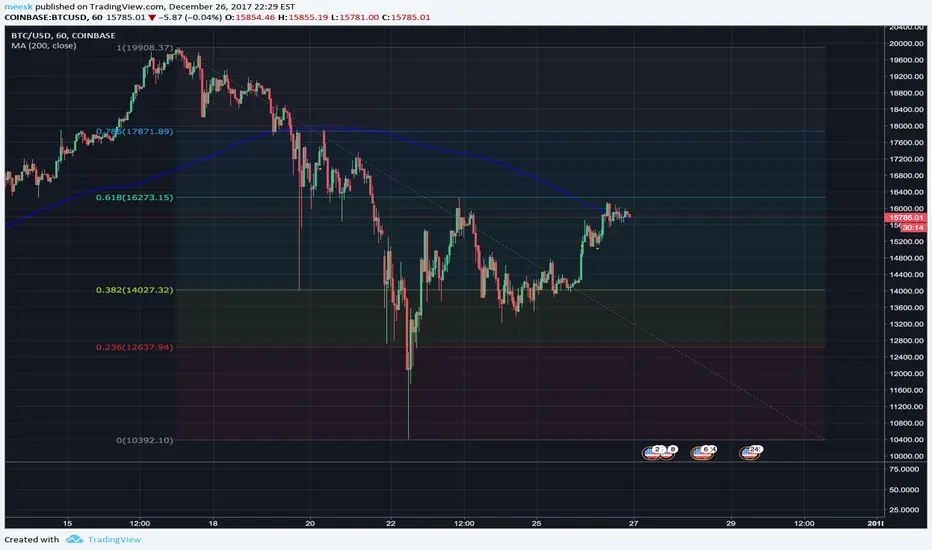
MA200 is acting as a strong dynamic resistance on the hourly chart. This resistance is also matching with the 0.618 Fibonacci retracement level.
The $15,460 - $16,270 zone is key to see if the correction will continue or if the bull trend is back for good.
The $15,460 - $16,270 zone is key to see if the correction will continue or if the bull trend is back for good.

Clause de non-responsabilité
Les informations et publications ne sont pas destinées à être, et ne constituent pas, des conseils ou recommandations financiers, d'investissement, de trading ou autres fournis ou approuvés par TradingView. Pour en savoir plus, consultez les Conditions d'utilisation.
Clause de non-responsabilité
Les informations et publications ne sont pas destinées à être, et ne constituent pas, des conseils ou recommandations financiers, d'investissement, de trading ou autres fournis ou approuvés par TradingView. Pour en savoir plus, consultez les Conditions d'utilisation.