
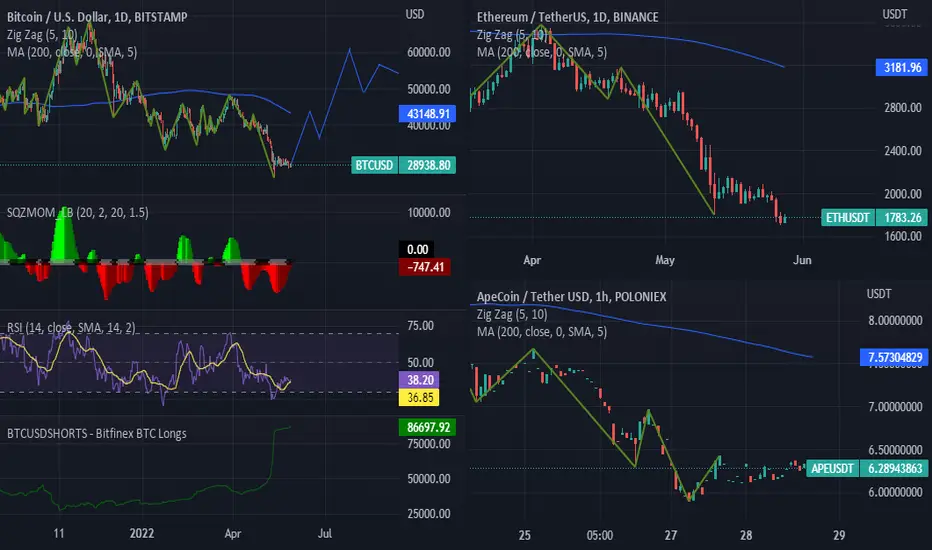
Ethereum and Bitcoin have both hit the lower end of the RSI Indicator. 8 weeks of red and frustration from recent events have created a situation where the new bull market could result in a possible new high. Most interestingly is the Weekly (14) RSI is at a history low indicating the market has exhausted its selling pressure. Targeting 63 RSI on the daily BITCOIN CHART followed by a correction before rocketing the Daily 73-77RSI range.

Clause de non-responsabilité
Les informations et publications ne sont pas destinées à être, et ne constituent pas, des conseils ou recommandations financiers, d'investissement, de trading ou autres fournis ou approuvés par TradingView. Pour en savoir plus, consultez les Conditions d'utilisation.
Clause de non-responsabilité
Les informations et publications ne sont pas destinées à être, et ne constituent pas, des conseils ou recommandations financiers, d'investissement, de trading ou autres fournis ou approuvés par TradingView. Pour en savoir plus, consultez les Conditions d'utilisation.