
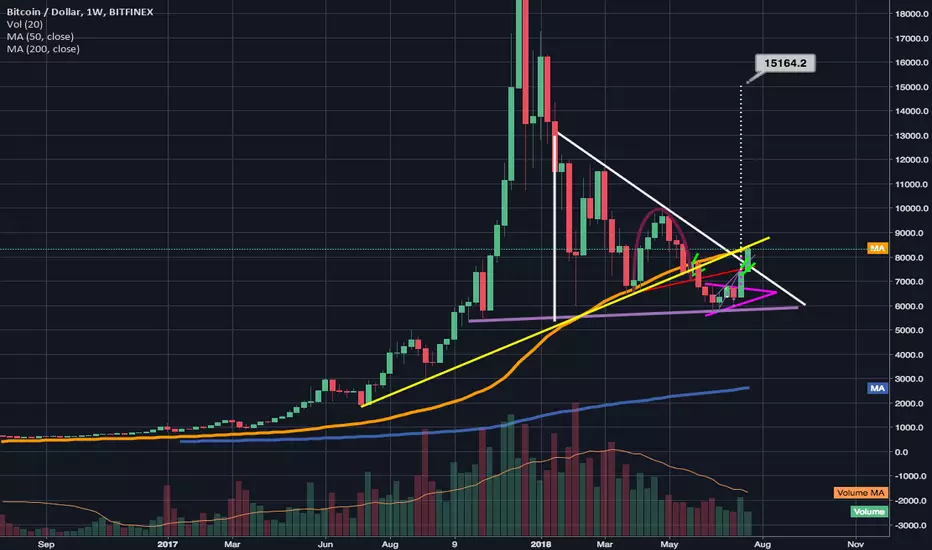
Something worth being aware of. Here on the 1 week chart we can see this diagonal yellow trendline is current resistance...if we trace it back to a year or so ago we can see it acted as a major line of support multiple times...once we crashed below it however it has now flipped to resistance and we can also see that it's current trajectory and prosition is almost identical to the 1 week 50ma (in orange) they are more or less currently converged for a double reinforced resistance...because of this btc has finally stalled (most likely temporaily) I anticipate any dip to be brief and we will likely even if the dip is more extreme than I'm expecting form a higher low on both the 1 day and 4hr charts before heading back upward and breaking through the current resistance. Something to be aware of anyways...I plan on buying the dip. You make your own decisions. Thanks for reading. *not financial advice*

Clause de non-responsabilité
Les informations et publications ne sont pas destinées à être, et ne constituent pas, des conseils ou recommandations financiers, d'investissement, de trading ou autres fournis ou approuvés par TradingView. Pour en savoir plus, consultez les Conditions d'utilisation.
Clause de non-responsabilité
Les informations et publications ne sont pas destinées à être, et ne constituent pas, des conseils ou recommandations financiers, d'investissement, de trading ou autres fournis ou approuvés par TradingView. Pour en savoir plus, consultez les Conditions d'utilisation.