
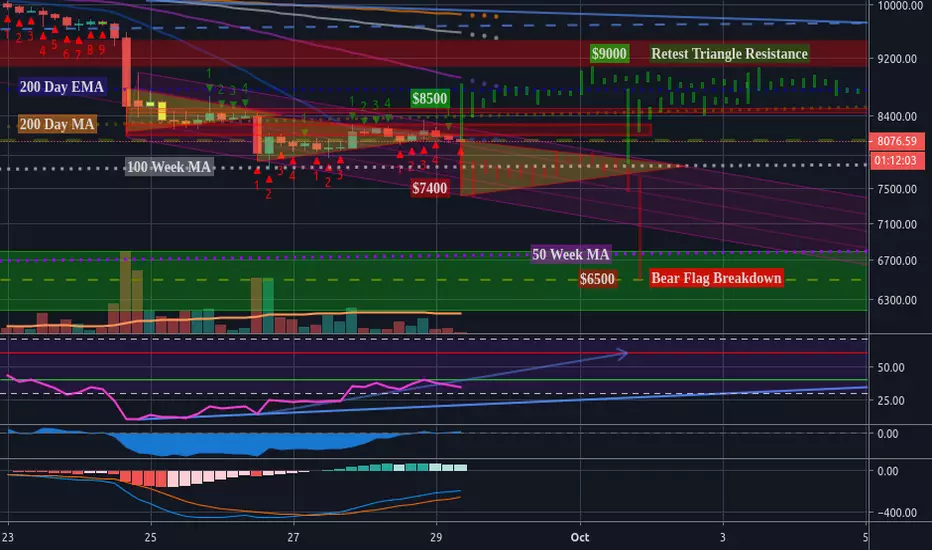
Currently remaining neutral while expecting a big enough move in either direction to either retest the triangle resistance around $9,000, or continue moving downwards towards the bear channel support around $7,500, likely followed by a bear flag breakdown to $6,500. Bitcoin notably got rejected by the 200 Day MA on yesterdays closing candle with current support llined up at the 100 Week MA around $7,750, followed by the 50 Week MA at around $6,750.
4hr RSI with bullish divergence in tact but enough room to move down to $7500 with ease.
MACD losing bullish momentum and still in the negative.
CMF is barely positive. Overall, slightly bearish.
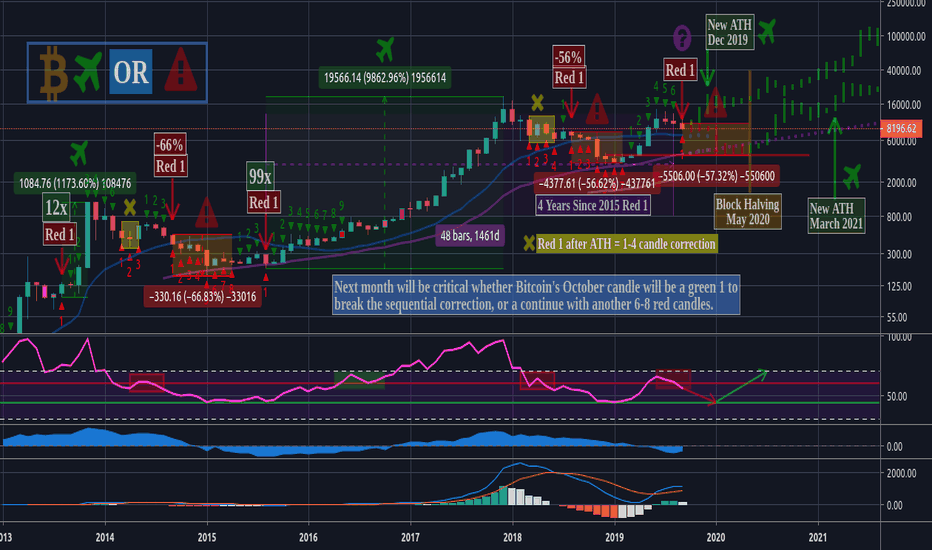
If Bitcoin Repeats History? Monthly TD Sequential Red 1 (Part 6)
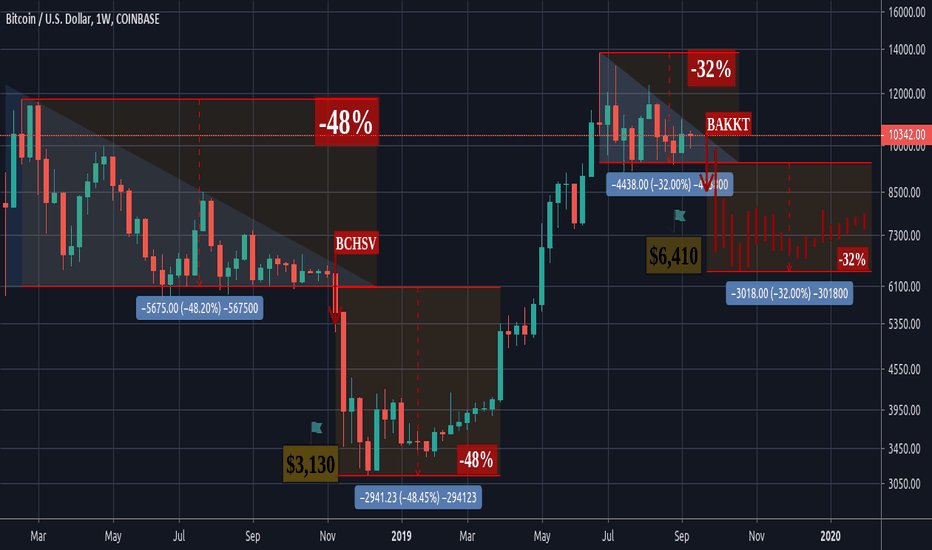
Measuring The Move of the Descending Triangle Breakdown (Part 2)
BTCUSD: Is Bitcoin Forming A Bear Flag To $6,750?

4hr RSI with bullish divergence in tact but enough room to move down to $7500 with ease.
MACD losing bullish momentum and still in the negative.
CMF is barely positive. Overall, slightly bearish.
If Bitcoin Repeats History? Monthly TD Sequential Red 1 (Part 6)
Measuring The Move of the Descending Triangle Breakdown (Part 2)
BTCUSD: Is Bitcoin Forming A Bear Flag To $6,750?
Note
Latest analysis: 4hr Descending Triangle Targeting $7K

Publications connexes
Clause de non-responsabilité
Les informations et publications ne sont pas destinées à être, et ne constituent pas, des conseils ou recommandations financiers, d'investissement, de trading ou autres fournis ou approuvés par TradingView. Pour en savoir plus, consultez les Conditions d'utilisation.
Publications connexes
Clause de non-responsabilité
Les informations et publications ne sont pas destinées à être, et ne constituent pas, des conseils ou recommandations financiers, d'investissement, de trading ou autres fournis ou approuvés par TradingView. Pour en savoir plus, consultez les Conditions d'utilisation.