
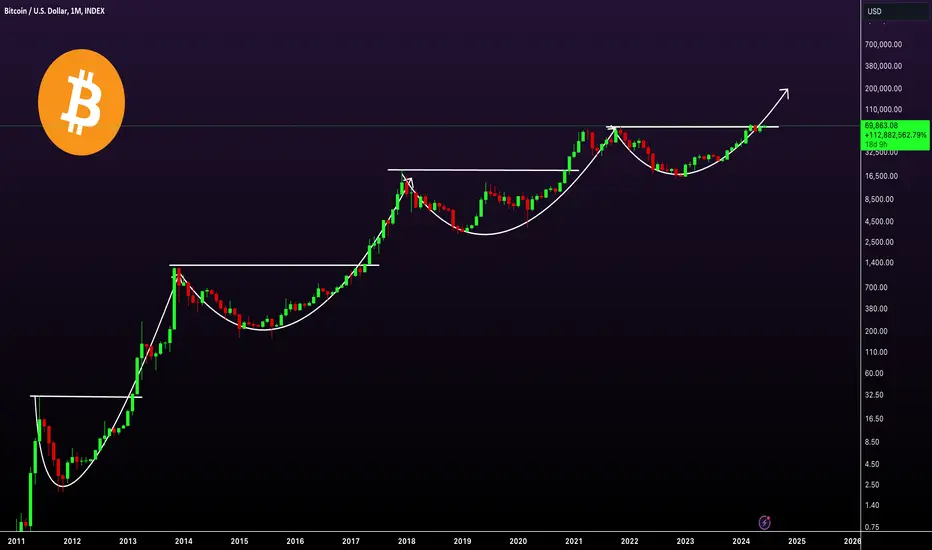
Bitcoin long-term chart analysis
In 2013, the price of Bitcoin broke its previous ATH and moved approximately 3700% after the breakout. In 2017, Bitcoin's price increased by over 1450% after breaking its previous ATH. In 2021, Bitcoin's price rose by more than 250% after the previous ATH breakout.
This year, the price broke the 2021 ATH. We can expect a bullish move from the current level, with a potential 100-200% increase in Bitcoin this year.
In 2013, the price of Bitcoin broke its previous ATH and moved approximately 3700% after the breakout. In 2017, Bitcoin's price increased by over 1450% after breaking its previous ATH. In 2021, Bitcoin's price rose by more than 250% after the previous ATH breakout.
This year, the price broke the 2021 ATH. We can expect a bullish move from the current level, with a potential 100-200% increase in Bitcoin this year.

🚀Telegram : t.me/hexatrades
🌐Website: hexatrades.io/
🗣️Twitter(X): twitter.com/HexaTrades
🌐Website: hexatrades.io/
🗣️Twitter(X): twitter.com/HexaTrades
Publications connexes
Clause de non-responsabilité
Les informations et publications ne sont pas destinées à être, et ne constituent pas, des conseils ou recommandations financiers, d'investissement, de trading ou autres fournis ou approuvés par TradingView. Pour en savoir plus, consultez les Conditions d'utilisation.
🚀Telegram : t.me/hexatrades
🌐Website: hexatrades.io/
🗣️Twitter(X): twitter.com/HexaTrades
🌐Website: hexatrades.io/
🗣️Twitter(X): twitter.com/HexaTrades
Publications connexes
Clause de non-responsabilité
Les informations et publications ne sont pas destinées à être, et ne constituent pas, des conseils ou recommandations financiers, d'investissement, de trading ou autres fournis ou approuvés par TradingView. Pour en savoir plus, consultez les Conditions d'utilisation.