
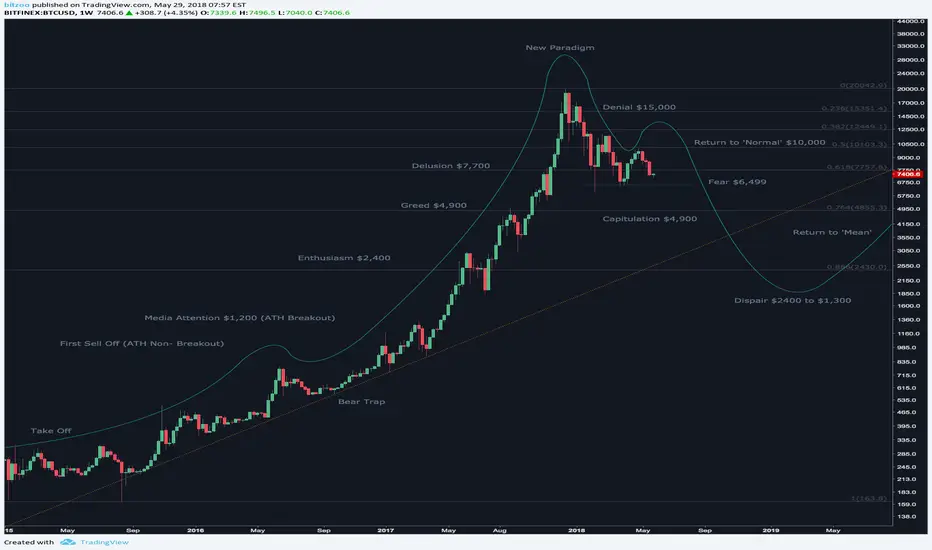
This chart is just for fun. Unless you are a Bull of course.
I have applied the stages of a bubble from here: transportgeography.org/?page_id=9035 - This is a worst case scenario for BTC.
I used fibs from the bottom at $162 to the top of the bull run at $19,900 to work out rough prices for the stages.
I have applied the stages of a bubble from here: transportgeography.org/?page_id=9035 - This is a worst case scenario for BTC.
I used fibs from the bottom at $162 to the top of the bull run at $19,900 to work out rough prices for the stages.

Publications connexes
Clause de non-responsabilité
Les informations et publications ne sont pas destinées à être, et ne constituent pas, des conseils ou recommandations financiers, d'investissement, de trading ou autres fournis ou approuvés par TradingView. Pour en savoir plus, consultez les Conditions d'utilisation.