
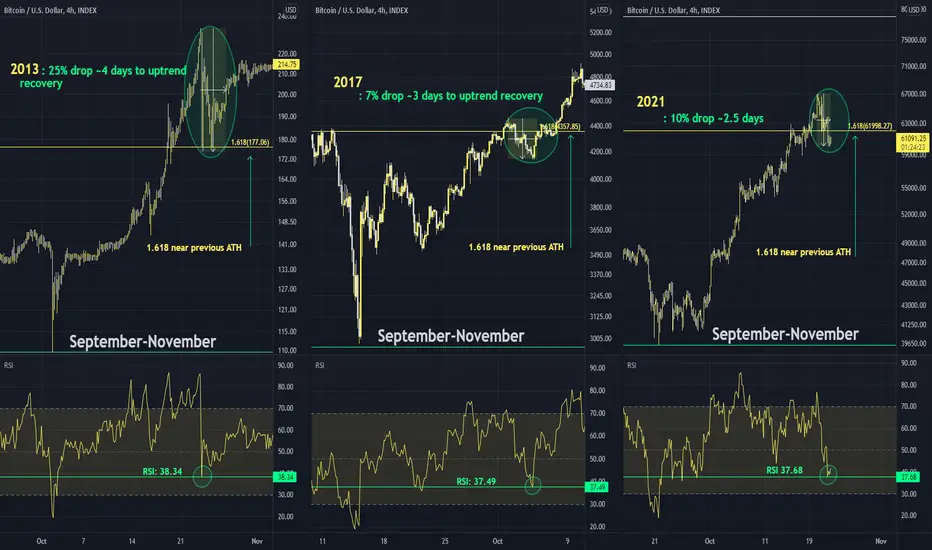
As you know, I'm always trying to find things that happen in both 2013 & 2017 before having conviction that what we're seeing is nothing different than before.
Since the reversals as the beginning of each chart shows, we've been following a pretty well paved path. The current pullback seems to remain along that path.
Similarities:
1: As we test & play around with the 1.618 log-based fib which is around the previous ATH, we have a short-lived pullback before an uptrend is recovered slowly again.
2: The sideways action lasts 3 days in 2017 and 4 days in 2013 before continuing on with an uptrend.
3: The RSI dropped to 38 in 2013 and 37 in 2017. We're struck right in between there this time.
4: Percentages aren't similar between the cycles, but I'll note them anyway: 25% drop in 2013 and 7% drop in 2017. We're currently at 10.5%
To see my convictions on why we'll see 200k+, see my related ideas. I think they'll persuade you as well.
Since the reversals as the beginning of each chart shows, we've been following a pretty well paved path. The current pullback seems to remain along that path.
Similarities:
1: As we test & play around with the 1.618 log-based fib which is around the previous ATH, we have a short-lived pullback before an uptrend is recovered slowly again.
2: The sideways action lasts 3 days in 2017 and 4 days in 2013 before continuing on with an uptrend.
3: The RSI dropped to 38 in 2013 and 37 in 2017. We're struck right in between there this time.
4: Percentages aren't similar between the cycles, but I'll note them anyway: 25% drop in 2013 and 7% drop in 2017. We're currently at 10.5%
To see my convictions on why we'll see 200k+, see my related ideas. I think they'll persuade you as well.

Publications connexes
Clause de non-responsabilité
Les informations et publications ne sont pas destinées à être, et ne constituent pas, des conseils ou recommandations financiers, d'investissement, de trading ou autres fournis ou approuvés par TradingView. Pour en savoir plus, consultez les Conditions d'utilisation.
Publications connexes
Clause de non-responsabilité
Les informations et publications ne sont pas destinées à être, et ne constituent pas, des conseils ou recommandations financiers, d'investissement, de trading ou autres fournis ou approuvés par TradingView. Pour en savoir plus, consultez les Conditions d'utilisation.