
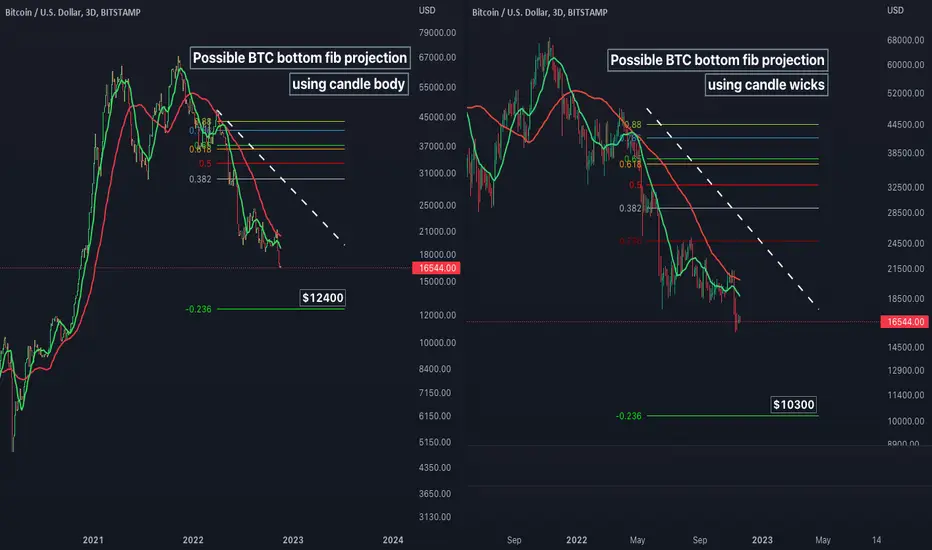
BTC price chart analysis on the 3Day time frame (Heikin-Ashi candles, wicks removed, log).
BTC appears to be completing a 5 wave down:
-I could go long layering in, if the price hits near these levels of -.23 fibonacci extension.
IMPORTANT
If the 3day 13 SMA crosses the 48 SMA up and both turn up, I default back to trend analysis
I could also add other indicators such as custom buy sell signals and or MACD , Stochastic , RSI , to assist my decisions but this is a simple projection.
None of this should be interpreted as financial advice, I am not a professional or certified financial adviser! all charts, and or analysis' are my personal opinions and observations only!
BTC appears to be completing a 5 wave down:
-I could go long layering in, if the price hits near these levels of -.23 fibonacci extension.
IMPORTANT
If the 3day 13 SMA crosses the 48 SMA up and both turn up, I default back to trend analysis
I could also add other indicators such as custom buy sell signals and or MACD , Stochastic , RSI , to assist my decisions but this is a simple projection.
None of this should be interpreted as financial advice, I am not a professional or certified financial adviser! all charts, and or analysis' are my personal opinions and observations only!

Clause de non-responsabilité
Les informations et publications ne sont pas destinées à être, et ne constituent pas, des conseils ou recommandations financiers, d'investissement, de trading ou autres fournis ou approuvés par TradingView. Pour en savoir plus, consultez les Conditions d'utilisation.
Clause de non-responsabilité
Les informations et publications ne sont pas destinées à être, et ne constituent pas, des conseils ou recommandations financiers, d'investissement, de trading ou autres fournis ou approuvés par TradingView. Pour en savoir plus, consultez les Conditions d'utilisation.