
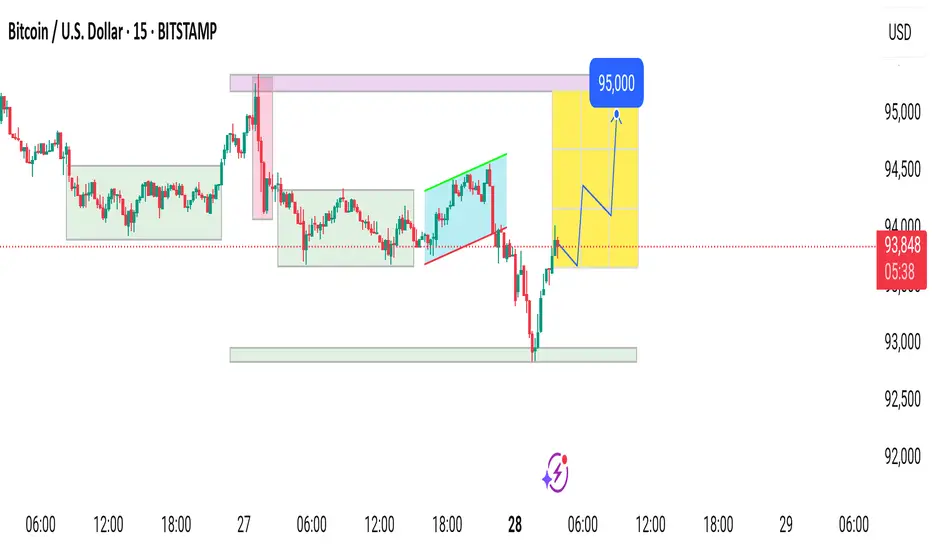
This 15-minute Bitcoin (BTC/USD) recent price action around key support and resistance zones. After a sharp dip to the lower green support area (~$92,500), the price is showing signs of a bullish reversal. The forecasted trajectory (highlighted in yellow) anticipates a corrective move before resuming an upward climb toward the $95,000 resistance target. Previous consolidation phases and a breakdown from a rising wedge pattern are also noted, suggesting a technical recovery is underway. Traders are watching for confirmation of this bullish setup.
Transaction en cours
Trade fermée: cible de profit atteinte

Clause de non-responsabilité
Les informations et publications ne sont pas destinées à être, et ne constituent pas, des conseils ou recommandations financiers, d'investissement, de trading ou autres fournis ou approuvés par TradingView. Pour en savoir plus, consultez les Conditions d'utilisation.
Clause de non-responsabilité
Les informations et publications ne sont pas destinées à être, et ne constituent pas, des conseils ou recommandations financiers, d'investissement, de trading ou autres fournis ou approuvés par TradingView. Pour en savoir plus, consultez les Conditions d'utilisation.