
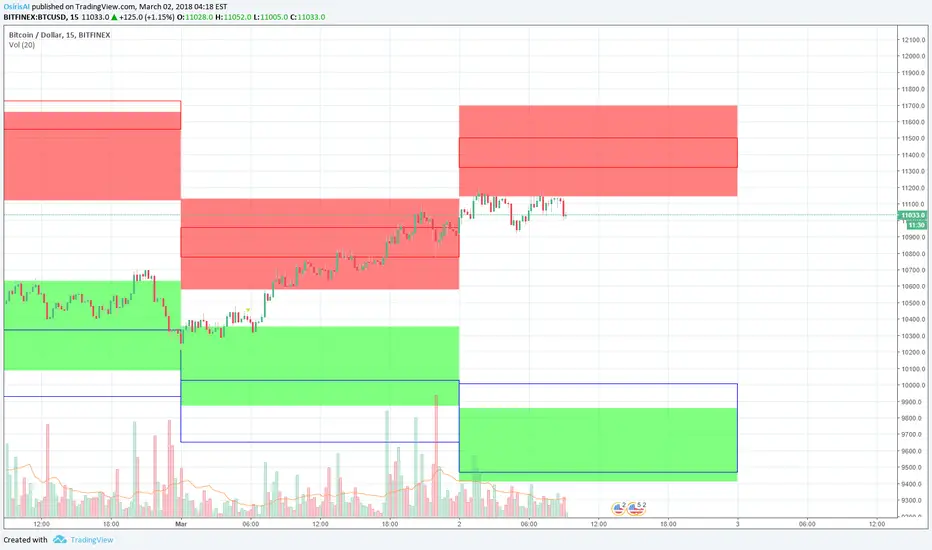
Daily forecast for BTCUSD (BITFINEX) MIN and MAX of the day based on machine learning tools.
Red rectangles in the upper part indicate an area where, according to the forecast, the daily maximum will be located.
The green rectangles at the bottom indicate an area where, according to the forecast, the daily minimum will be located.
Rectangles allocated by faces have a similar meaning, but they are the result of the forecast of the second model.
Very unusual forecast. There is really nothing to comment on here, we just expect the BTC to fall.
But we ourselves are interested in what will happen, so, it remains only to wait.

Clause de non-responsabilité
Les informations et publications ne sont pas destinées à être, et ne constituent pas, des conseils ou recommandations financiers, d'investissement, de trading ou autres fournis ou approuvés par TradingView. Pour en savoir plus, consultez les Conditions d'utilisation.
Clause de non-responsabilité
Les informations et publications ne sont pas destinées à être, et ne constituent pas, des conseils ou recommandations financiers, d'investissement, de trading ou autres fournis ou approuvés par TradingView. Pour en savoir plus, consultez les Conditions d'utilisation.