
Hello, traders!🧨
We continue to watch the crash unfold in real time⚰️
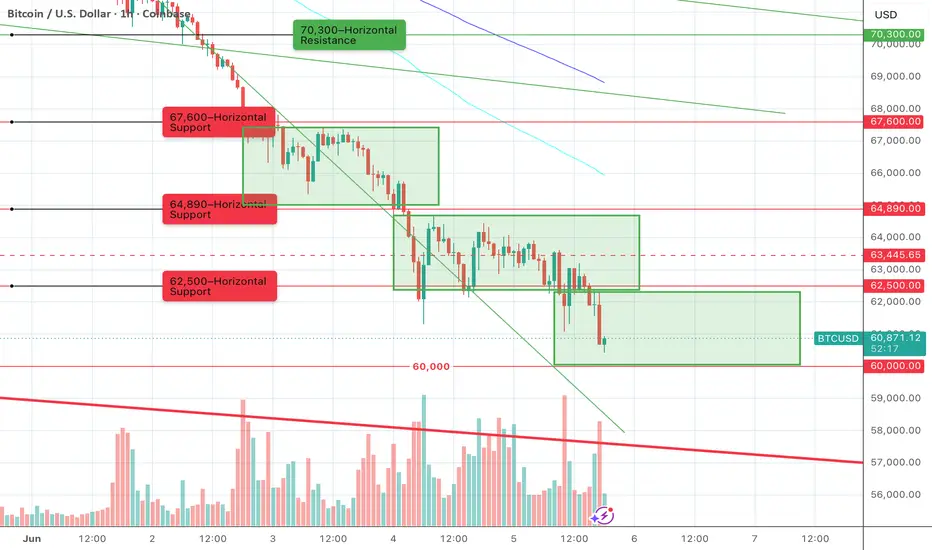
The decline is developing in waves, following almost the exact same pattern each time: a key horizontal support breaks, price attempts to move into a sideways range, fails, and then another leg down follows.
❗️First, the 67,600 level was lost. After that, price attempted to establish a range between 64,890 and 67,600. The attempt failed, and the market moved lower.
❗️Over the past 24 hours, the same scenario repeated once again. The 64,890 level was broken, followed by an attempt to form a range between 62,500 and 64,890. That attempt also failed, leading to another wave of selling.
✅✅✅The next potential bounce and attempt to move into a sideways range could occur around the 60,000 level.
For now, the market structure remains unchanged — every local range ends with a downside breakout and a continuation of the downtrend.
Peace🌄
We continue to watch the crash unfold in real time⚰️
The decline is developing in waves, following almost the exact same pattern each time: a key horizontal support breaks, price attempts to move into a sideways range, fails, and then another leg down follows.
❗️First, the 67,600 level was lost. After that, price attempted to establish a range between 64,890 and 67,600. The attempt failed, and the market moved lower.
❗️Over the past 24 hours, the same scenario repeated once again. The 64,890 level was broken, followed by an attempt to form a range between 62,500 and 64,890. That attempt also failed, leading to another wave of selling.
✅✅✅The next potential bounce and attempt to move into a sideways range could occur around the 60,000 level.
For now, the market structure remains unchanged — every local range ends with a downside breakout and a continuation of the downtrend.
Peace🌄

Clause de non-responsabilité
Les informations et publications ne sont pas destinées à être, et ne constituent pas, des conseils ou recommandations financiers, d'investissement, de trading ou autres fournis ou approuvés par TradingView. Pour en savoir plus, consultez les Conditions d'utilisation.
Clause de non-responsabilité
Les informations et publications ne sont pas destinées à être, et ne constituent pas, des conseils ou recommandations financiers, d'investissement, de trading ou autres fournis ou approuvés par TradingView. Pour en savoir plus, consultez les Conditions d'utilisation.