
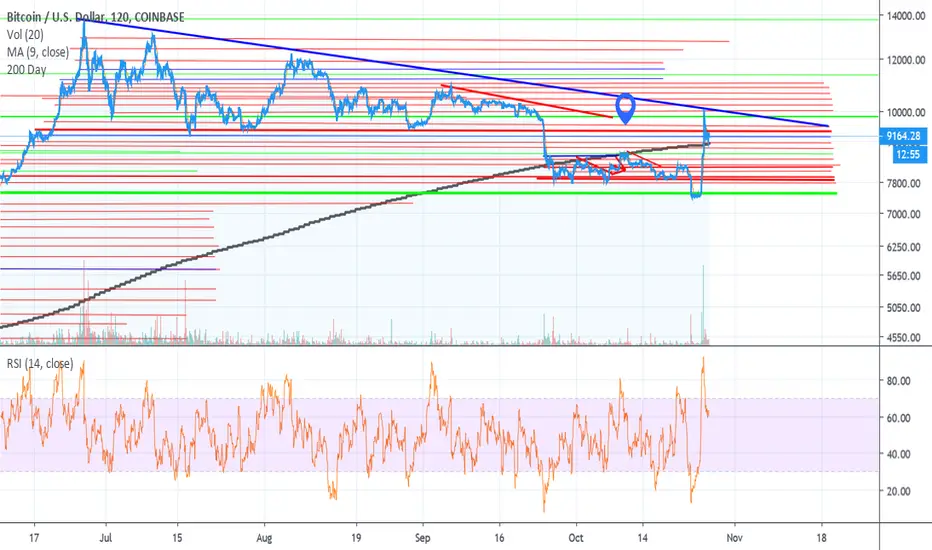
wOw, if you look at the downward sloping trendline that I've colored blue, you'll notice it's the top of the descending triangle we were trading in before the capitulation around sept 23rd. Right when the FED launched QE 4EVER & loaned a Bank charged under the RICO 52 Billion dollars in one night, probably to short Bitcoin in fear of what Bakkt would do to the price.
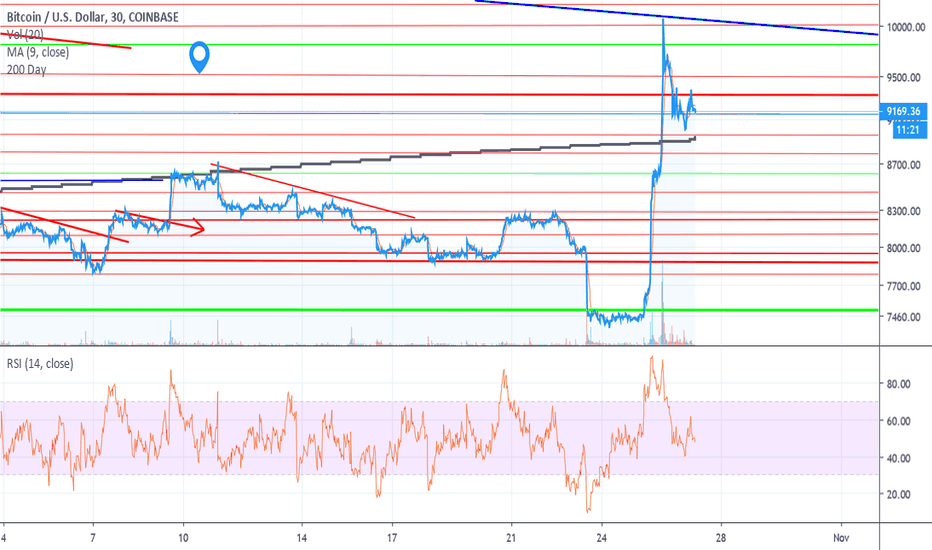
Anyway, Bitcoin jumped over that 200 Day MA, but we will stay over? Anytime Bitcoin has been in a bull market throughout its history its traded above the 200 Day MA.
Time will tell per usual.
Anyway, Bitcoin jumped over that 200 Day MA, but we will stay over? Anytime Bitcoin has been in a bull market throughout its history its traded above the 200 Day MA.
Time will tell per usual.
Note

Publications connexes
Clause de non-responsabilité
Les informations et publications ne sont pas destinées à être, et ne constituent pas, des conseils ou recommandations financiers, d'investissement, de trading ou autres fournis ou approuvés par TradingView. Pour en savoir plus, consultez les Conditions d'utilisation.
Publications connexes
Clause de non-responsabilité
Les informations et publications ne sont pas destinées à être, et ne constituent pas, des conseils ou recommandations financiers, d'investissement, de trading ou autres fournis ou approuvés par TradingView. Pour en savoir plus, consultez les Conditions d'utilisation.