
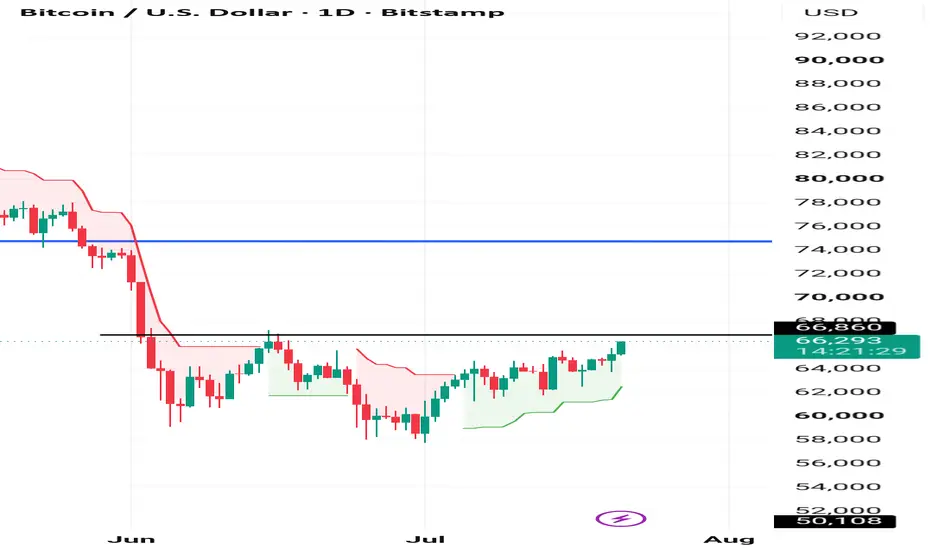
Bitcoin (BTCUSD) – Daily Chart Analysis
📈 Current Price: 66,283
📊 Trend
Short-term trend is bullish.
Price is trading above the Supertrend, indicating buyers are in control.
BTC is making Higher Highs and Higher Lows, which is a positive sign.
🔑 Key Levels
🟢 Support
64,000–65,000 – Immediate support
61,000–62,000 – Strong support
50,100 – Major long-term support
🔴 Resistance
66,860 – Immediate resistance (currently testing)
74,000 – Major breakout level
107,631 – Long-term resistance
📈 Bullish Scenario
A daily close above 66,860 could push BTC toward 70,000–74,000.
A breakout above 74,000 may start the next major bullish leg.
📉 Bearish Scenario
If BTC fails to hold above 64,000, it could decline toward 61,000–62,000.
A break below that zone may increase selling pressure.
🎯 Trading View
Buy Zone: 64,000–65,000 (after bullish confirmation)
Breakout Buy: Above 66,860 with strong volume
Stop Loss: Below 64,000 (for short-term trades)
Overall View:
Bitcoin is approaching a key resistance at 66,860. A confirmed breakout above this level could strengthen bullish momentum, while rejection may lead to a short-term pullback before the next move.
📈 Current Price: 66,283
📊 Trend
Short-term trend is bullish.
Price is trading above the Supertrend, indicating buyers are in control.
BTC is making Higher Highs and Higher Lows, which is a positive sign.
🔑 Key Levels
🟢 Support
64,000–65,000 – Immediate support
61,000–62,000 – Strong support
50,100 – Major long-term support
🔴 Resistance
66,860 – Immediate resistance (currently testing)
74,000 – Major breakout level
107,631 – Long-term resistance
📈 Bullish Scenario
A daily close above 66,860 could push BTC toward 70,000–74,000.
A breakout above 74,000 may start the next major bullish leg.
📉 Bearish Scenario
If BTC fails to hold above 64,000, it could decline toward 61,000–62,000.
A break below that zone may increase selling pressure.
🎯 Trading View
Buy Zone: 64,000–65,000 (after bullish confirmation)
Breakout Buy: Above 66,860 with strong volume
Stop Loss: Below 64,000 (for short-term trades)
Overall View:
Bitcoin is approaching a key resistance at 66,860. A confirmed breakout above this level could strengthen bullish momentum, while rejection may lead to a short-term pullback before the next move.

Clause de non-responsabilité
Les informations et publications ne sont pas destinées à être, et ne constituent pas, des conseils ou recommandations financiers, d'investissement, de trading ou autres fournis ou approuvés par TradingView. Pour en savoir plus, consultez les Conditions d'utilisation.
Clause de non-responsabilité
Les informations et publications ne sont pas destinées à être, et ne constituent pas, des conseils ou recommandations financiers, d'investissement, de trading ou autres fournis ou approuvés par TradingView. Pour en savoir plus, consultez les Conditions d'utilisation.