
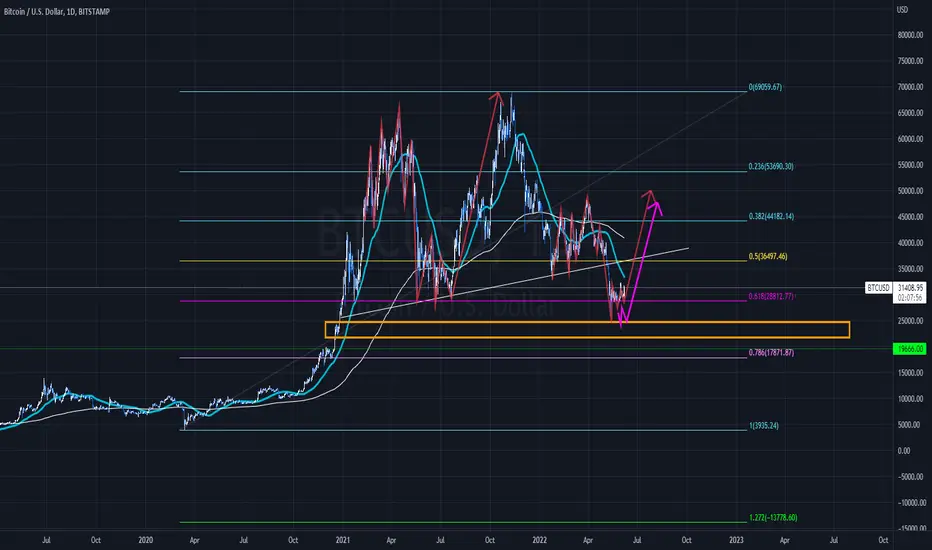
Drew this chart about 1.5 weeks ago. The idea was that we are in the same fractal as illustrated previous to the current one and we either bounce of the major 61.8 (red wave) the upwards or 20k retest then upwards (pink wave), or break below 20k and potentially begin a multi-year bear market.
Let's see.
Let's see.

Clause de non-responsabilité
Les informations et publications ne sont pas destinées à être, et ne constituent pas, des conseils ou recommandations financiers, d'investissement, de trading ou autres fournis ou approuvés par TradingView. Pour en savoir plus, consultez les Conditions d'utilisation.
Clause de non-responsabilité
Les informations et publications ne sont pas destinées à être, et ne constituent pas, des conseils ou recommandations financiers, d'investissement, de trading ou autres fournis ou approuvés par TradingView. Pour en savoir plus, consultez les Conditions d'utilisation.