
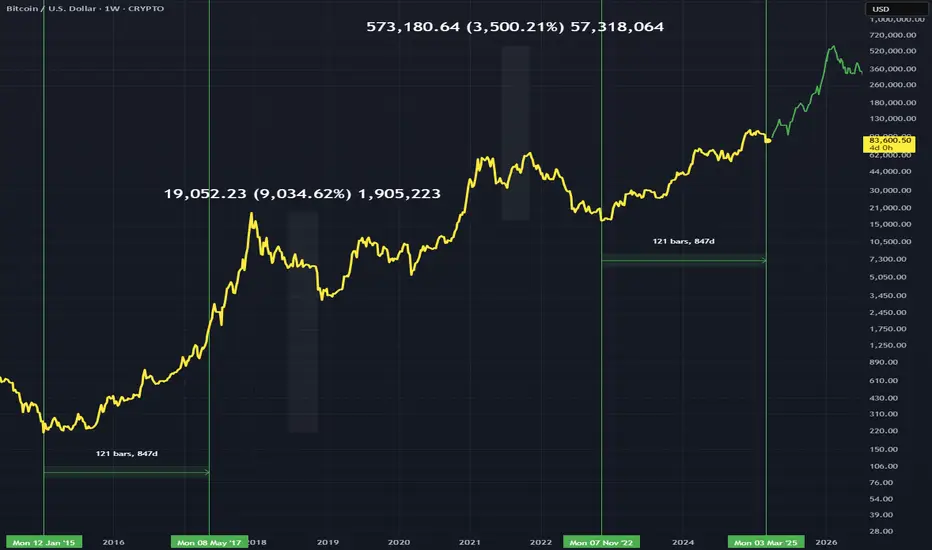
If we are experiencing a similar run to 2017 we would be 847days into the bull run
I have shown the bars pattern for where price could go with the rest of the time left, which shows a 3500% gain this bull market. This is compared to the 2017 run which was a 9000% gain to the top.
We have some bull time left is the take away if the runs are comparable.
Weekly chart.
I have shown the bars pattern for where price could go with the rest of the time left, which shows a 3500% gain this bull market. This is compared to the 2017 run which was a 9000% gain to the top.
We have some bull time left is the take away if the runs are comparable.
Weekly chart.

Clause de non-responsabilité
Les informations et publications ne sont pas destinées à être, et ne constituent pas, des conseils ou recommandations financiers, d'investissement, de trading ou autres fournis ou approuvés par TradingView. Pour en savoir plus, consultez les Conditions d'utilisation.
Clause de non-responsabilité
Les informations et publications ne sont pas destinées à être, et ne constituent pas, des conseils ou recommandations financiers, d'investissement, de trading ou autres fournis ou approuvés par TradingView. Pour en savoir plus, consultez les Conditions d'utilisation.