
Technical Analysis and Outlook:
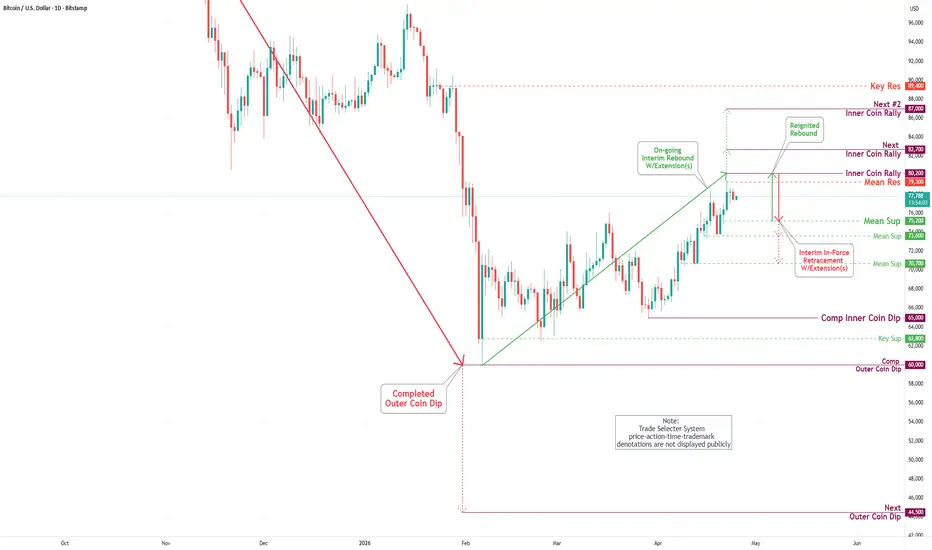
Bitcoin prices retested a crucial support level at $74,000 in this week's trading session and then surged strongly to the upside, retesting the Inner Coin rally at $78,500. Currently, the cryptocurrency is unfolding an upward move towards the extended target of $80,200, via a Key Resistance at $79,300.
Advanced market analysis indicates a continuous upward momentum towards the specified target. However, once this target is reached, we anticipate an interim retracement down to the identified Mean Support at $75,200, with additional potential support target levels at $73,600 and $70,700 to consider.
In light of all relevant factors, a notable rebound is expected to occur upon reaching the identified support levels.
Bitcoin prices retested a crucial support level at $74,000 in this week's trading session and then surged strongly to the upside, retesting the Inner Coin rally at $78,500. Currently, the cryptocurrency is unfolding an upward move towards the extended target of $80,200, via a Key Resistance at $79,300.
Advanced market analysis indicates a continuous upward momentum towards the specified target. However, once this target is reached, we anticipate an interim retracement down to the identified Mean Support at $75,200, with additional potential support target levels at $73,600 and $70,700 to consider.
In light of all relevant factors, a notable rebound is expected to occur upon reaching the identified support levels.

Publications connexes
Clause de non-responsabilité
Les informations et publications ne sont pas destinées à être, et ne constituent pas, des conseils ou recommandations financiers, d'investissement, de trading ou autres fournis ou approuvés par TradingView. Pour en savoir plus, consultez les Conditions d'utilisation.
Publications connexes
Clause de non-responsabilité
Les informations et publications ne sont pas destinées à être, et ne constituent pas, des conseils ou recommandations financiers, d'investissement, de trading ou autres fournis ou approuvés par TradingView. Pour en savoir plus, consultez les Conditions d'utilisation.