
Technical Analysis and Outlook:
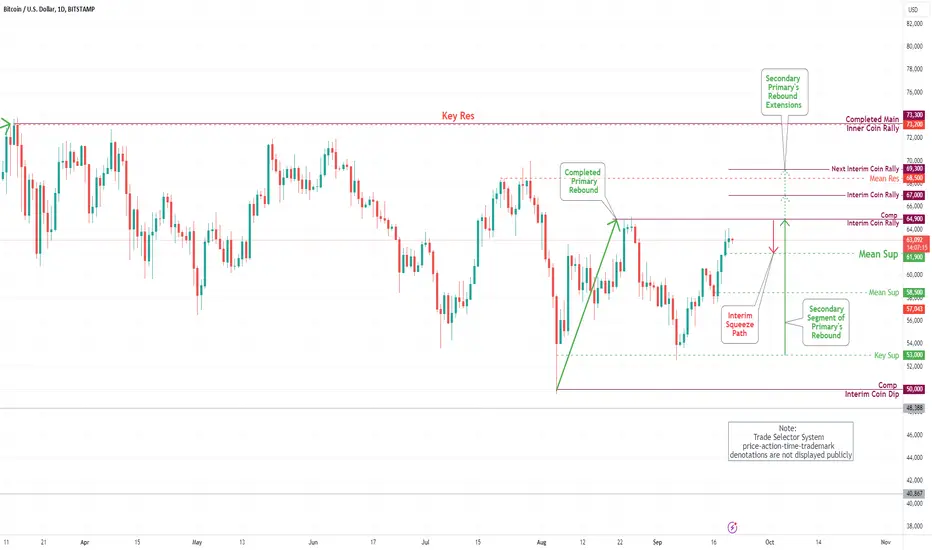
The current market activity exhibits a robust recovery from our Mean Support level at 57300, surpassing the Mean Resistance of 60500. It is poised to achieve our secondary rebound target: the Completed Interim Coin Rally denoted at 64500. Nonetheless, prevailing market sentiment suggests a potential retracement to the Mean Support level at 61900 before initiating the primary recovery and progressing into the subsequent phase to retest our completed Interim Coin Rally at 64900 and beyond.
The current market activity exhibits a robust recovery from our Mean Support level at 57300, surpassing the Mean Resistance of 60500. It is poised to achieve our secondary rebound target: the Completed Interim Coin Rally denoted at 64500. Nonetheless, prevailing market sentiment suggests a potential retracement to the Mean Support level at 61900 before initiating the primary recovery and progressing into the subsequent phase to retest our completed Interim Coin Rally at 64900 and beyond.

Publications connexes
Clause de non-responsabilité
Les informations et publications ne sont pas destinées à être, et ne constituent pas, des conseils ou recommandations financiers, d'investissement, de trading ou autres fournis ou approuvés par TradingView. Pour en savoir plus, consultez les Conditions d'utilisation.
Publications connexes
Clause de non-responsabilité
Les informations et publications ne sont pas destinées à être, et ne constituent pas, des conseils ou recommandations financiers, d'investissement, de trading ou autres fournis ou approuvés par TradingView. Pour en savoir plus, consultez les Conditions d'utilisation.