
Before you ask yourself if i just drew these fibonacci levels, the reply is no, they are dating from this chart below
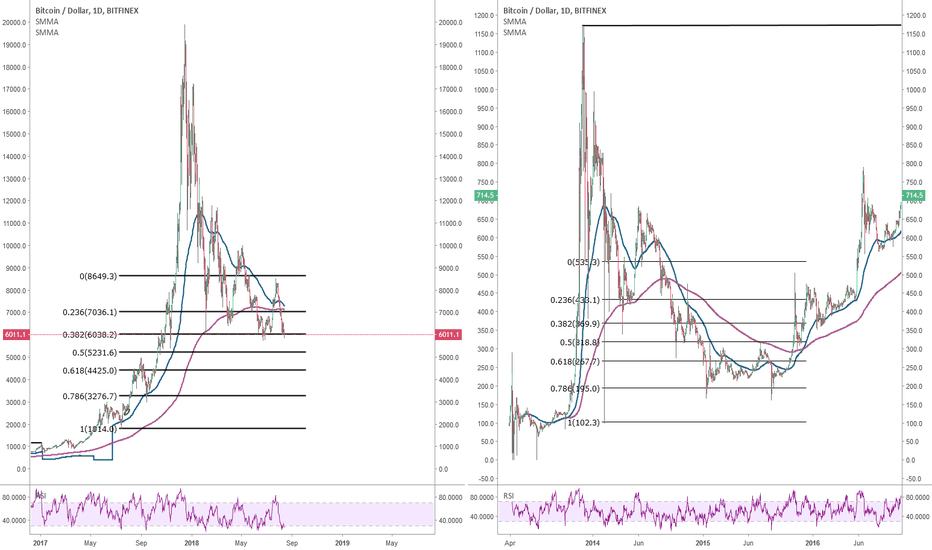
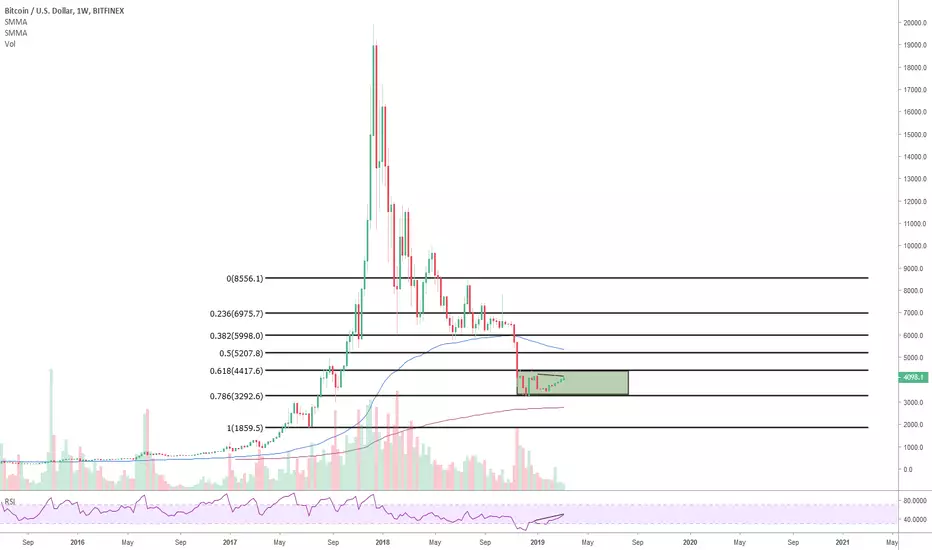
Same as in 2015: .786 is a natural level, it ended up the bear market, so there is definitely a possibility that the same natural move happens right now.
It still could fall below and the weekly pink 200 Smma could stop Btc and a spring could form at this level.
It could still fall below this pink 200 Smma and hit the 1888$ area where all this reactive bullish and parabolic structure started.
I would say the odds are 50/50
The daily chart is still showing the 50Smma as resistive for now

I would honnestly only rely on the rectangle and the 50 and 200 daily Smmas to see if the market is forming a bottom.
For now it is too early to shout victory, but there is definitely a possibility that this is a market bottom.
We need some more months to have a confirmation, only hindsight can confirm that.
Stay safe if you are still in the space.
Same as in 2015: .786 is a natural level, it ended up the bear market, so there is definitely a possibility that the same natural move happens right now.
It still could fall below and the weekly pink 200 Smma could stop Btc and a spring could form at this level.
It could still fall below this pink 200 Smma and hit the 1888$ area where all this reactive bullish and parabolic structure started.
I would say the odds are 50/50
The daily chart is still showing the 50Smma as resistive for now
I would honnestly only rely on the rectangle and the 50 and 200 daily Smmas to see if the market is forming a bottom.
For now it is too early to shout victory, but there is definitely a possibility that this is a market bottom.
We need some more months to have a confirmation, only hindsight can confirm that.
Stay safe if you are still in the space.
Note
This is the daily 50 Smma:Note
Expecting a false breakout of this blue Smma soon, with a few daily candles over it (maybe 4200$) then a retracement to the 3500-3300$ zone

Clause de non-responsabilité
Les informations et publications ne sont pas destinées à être, et ne constituent pas, des conseils ou recommandations financiers, d'investissement, de trading ou autres fournis ou approuvés par TradingView. Pour en savoir plus, consultez les Conditions d'utilisation.
Clause de non-responsabilité
Les informations et publications ne sont pas destinées à être, et ne constituent pas, des conseils ou recommandations financiers, d'investissement, de trading ou autres fournis ou approuvés par TradingView. Pour en savoir plus, consultez les Conditions d'utilisation.