
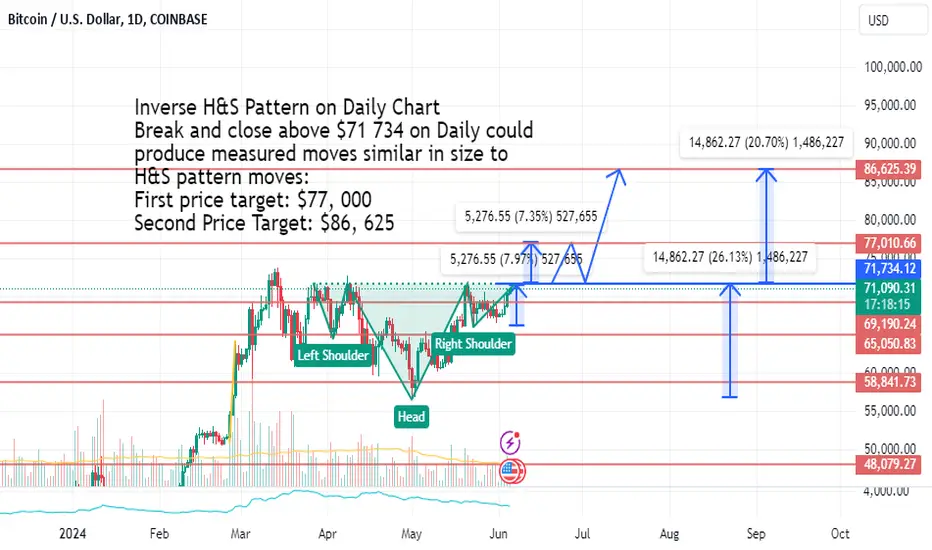
Inverse H&S Pattern is almost completely formed on the Daily Chart.
A Break and close above $71 734 on Daily chart could result in measured moves corresponding with the moves in the Inverse head and shoulder pattern. My prediction: if a Daily close above this level, then we'd see a break upwards to $FWB:77K, retrace back to neckline, and bounce up to $86, 625.
First price target: $77, 000
Second Price Target: $86, 625
Amateur pattern and technical analysis trader. NOT investment advice. Making these posts to document my own journey and thought processes/development on here.
A Break and close above $71 734 on Daily chart could result in measured moves corresponding with the moves in the Inverse head and shoulder pattern. My prediction: if a Daily close above this level, then we'd see a break upwards to $FWB:77K, retrace back to neckline, and bounce up to $86, 625.
First price target: $77, 000
Second Price Target: $86, 625
Amateur pattern and technical analysis trader. NOT investment advice. Making these posts to document my own journey and thought processes/development on here.

Clause de non-responsabilité
Les informations et publications ne sont pas destinées à être, et ne constituent pas, des conseils ou recommandations financiers, d'investissement, de trading ou autres fournis ou approuvés par TradingView. Pour en savoir plus, consultez les Conditions d'utilisation.
Clause de non-responsabilité
Les informations et publications ne sont pas destinées à être, et ne constituent pas, des conseils ou recommandations financiers, d'investissement, de trading ou autres fournis ou approuvés par TradingView. Pour en savoir plus, consultez les Conditions d'utilisation.