
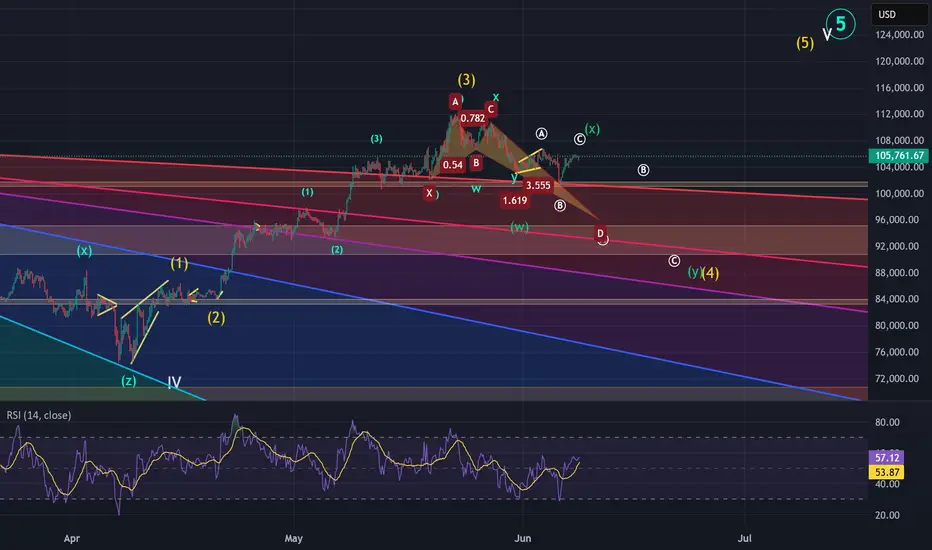
In my view, we are currently entering an A-B-C corrective wave, which is part of wave (4) and will complete wave (iv).
The bullish Crab harmonic pattern suggests that wave Ⓐ of (4) should bottom around 95,600–96,000. Following that, the Gann fan indicates that wave Ⓑ could rise to the 100,000–101,000 range, which also aligns with a key resistance zone.
For wave Ⓒ, the Gann fan suggests a downward move to around 94,000–92,000, a zone that corresponds to strong support.
Once wave (4) completes, the market should be positioned to begin wave (5), which will finalize the larger wave ⑤.
A key validation level to watch is 84,000. If the price drops below this level, the count would be invalidated, as wave (4) cannot fall below the low of wave (2).
The bullish Crab harmonic pattern suggests that wave Ⓐ of (4) should bottom around 95,600–96,000. Following that, the Gann fan indicates that wave Ⓑ could rise to the 100,000–101,000 range, which also aligns with a key resistance zone.
For wave Ⓒ, the Gann fan suggests a downward move to around 94,000–92,000, a zone that corresponds to strong support.
Once wave (4) completes, the market should be positioned to begin wave (5), which will finalize the larger wave ⑤.
A key validation level to watch is 84,000. If the price drops below this level, the count would be invalidated, as wave (4) cannot fall below the low of wave (2).

Clause de non-responsabilité
Les informations et publications ne sont pas destinées à être, et ne constituent pas, des conseils ou recommandations financiers, d'investissement, de trading ou autres fournis ou approuvés par TradingView. Pour en savoir plus, consultez les Conditions d'utilisation.
Clause de non-responsabilité
Les informations et publications ne sont pas destinées à être, et ne constituent pas, des conseils ou recommandations financiers, d'investissement, de trading ou autres fournis ou approuvés par TradingView. Pour en savoir plus, consultez les Conditions d'utilisation.