
Please support this idea with a LIKE👍 if you find it useful🥳
Not a financial advice🙅🏼♂️
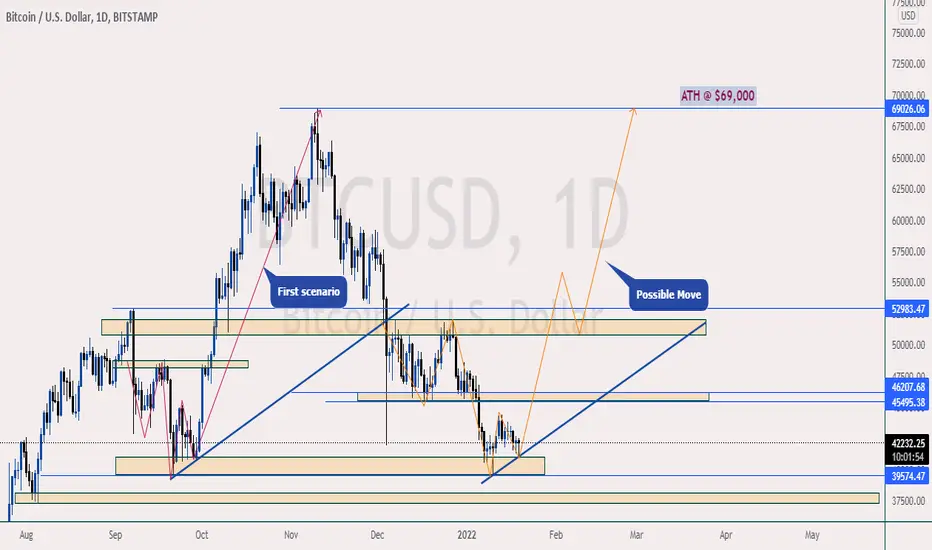
From the first scenario, we can see price fall from the supply zone down to the $40,000 demand region.
Then it started to rise again with a double bottom pattern on a new trend which took it to ATH at $69,000.
Now we have a similar scenario on the current chart. Will history repeat itself?
What do you think?
Share your opinion in the comment section✍️
Follow me to receive more updates on BTCUSD ( BITCOIN ) 🤗
Happy Trading💰🥳🤗
Not a financial advice🙅🏼♂️
From the first scenario, we can see price fall from the supply zone down to the $40,000 demand region.
Then it started to rise again with a double bottom pattern on a new trend which took it to ATH at $69,000.
Now we have a similar scenario on the current chart. Will history repeat itself?
What do you think?
Share your opinion in the comment section✍️
Follow me to receive more updates on BTCUSD ( BITCOIN ) 🤗
Happy Trading💰🥳🤗
Transaction en cours
YES👆 OR NO👇 ??
Publications connexes
Clause de non-responsabilité
Les informations et publications ne sont pas destinées à être, et ne constituent pas, des conseils ou recommandations financiers, d'investissement, de trading ou autres fournis ou approuvés par TradingView. Pour en savoir plus, consultez les Conditions d'utilisation.
Publications connexes
Clause de non-responsabilité
Les informations et publications ne sont pas destinées à être, et ne constituent pas, des conseils ou recommandations financiers, d'investissement, de trading ou autres fournis ou approuvés par TradingView. Pour en savoir plus, consultez les Conditions d'utilisation.