
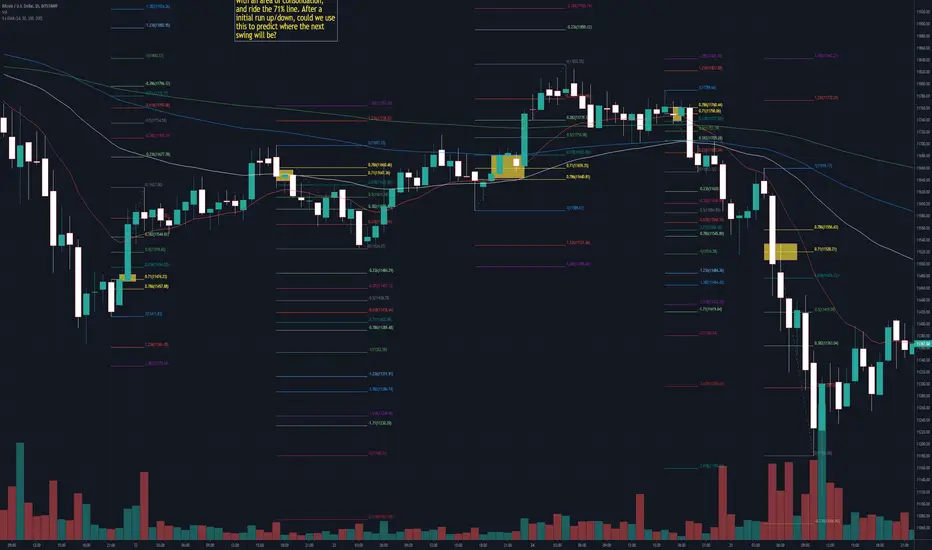
I have started to notice that, when I draw my Fib's, between the initial run from 1.0 to 0.0, the 0.71 often ends up aligning with an area of consolidation, and ride the 71% line. After a initial run up/down, could we use this to predict where the next swing will be?

Clause de non-responsabilité
Les informations et publications ne sont pas destinées à être, et ne constituent pas, des conseils ou recommandations financiers, d'investissement, de trading ou autres fournis ou approuvés par TradingView. Pour en savoir plus, consultez les Conditions d'utilisation.
Clause de non-responsabilité
Les informations et publications ne sont pas destinées à être, et ne constituent pas, des conseils ou recommandations financiers, d'investissement, de trading ou autres fournis ou approuvés par TradingView. Pour en savoir plus, consultez les Conditions d'utilisation.