
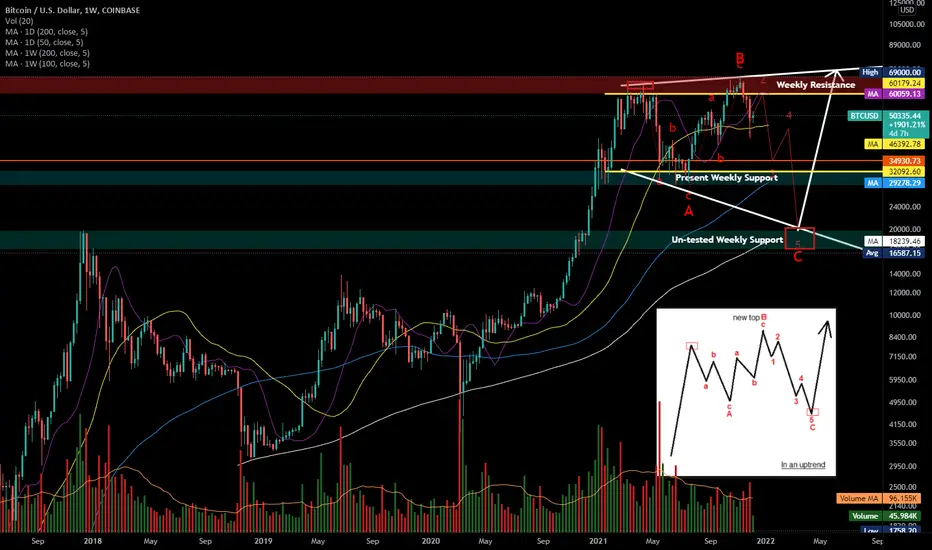
Previously I saw what looked like an expanded flat correction on the 4H chart, but it went lower than expected and, if it doesn't correct higher than our ATH and instead turns back down around 60-63k, then I think we should start considering that we'll see a prolonged correction that eventually re-tests our previous weekly support, which has never been re-tested.
For the bull now case, Bitcoin doesn't often re-test it's old support levels after an extended clear break above it, but it's still possible that it does do it, this time.
If this pattern remains relevant, then we won't see a new ATH until sometime around mid-late 2022, and we could drop down as low as 14.5-20k.
Confluence added to this idea via Daily 50 & 200 MAs and Weekly 100 & 200 MAs, which all point to prices potentially stopping at the suggested levels. That said, note that our daily 50/200 recently printed a Golden Cross (yet, it is still possible we that cross back/forth multiple times within the current structure before confirming a direction, especially considering we saw a death cross just prior).
I'm still of the mind that we are in a bull market that isn't yet complete and is preparing for a blow off top. This scenario just means that happens much later, and provides more opportunity for accumulation beforehand.
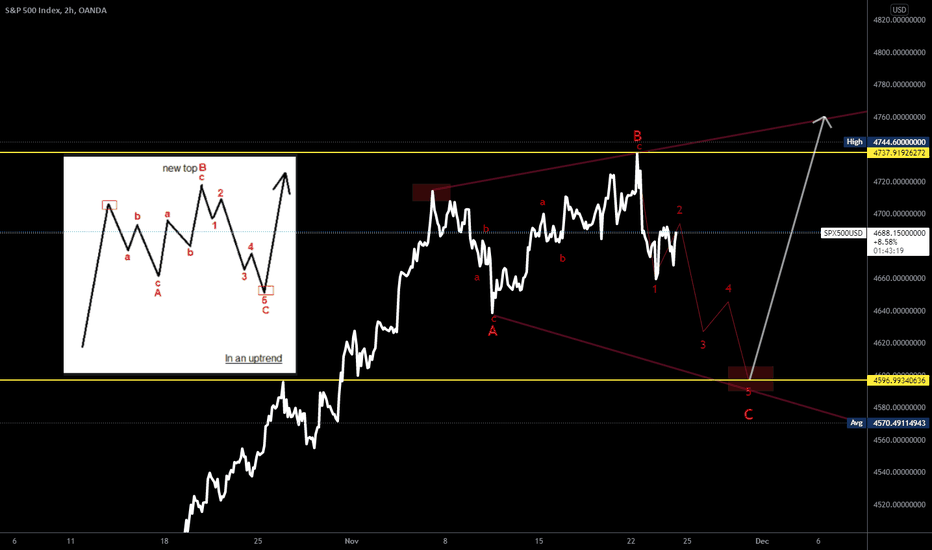
The alternative is that we still are in an expanded flat on the lower timeframes, it simply corrected lower than expected, and is about to print a blow off top in the more immediate future, similar to what S&P500 appears to be doing now, and as previously suggested here:
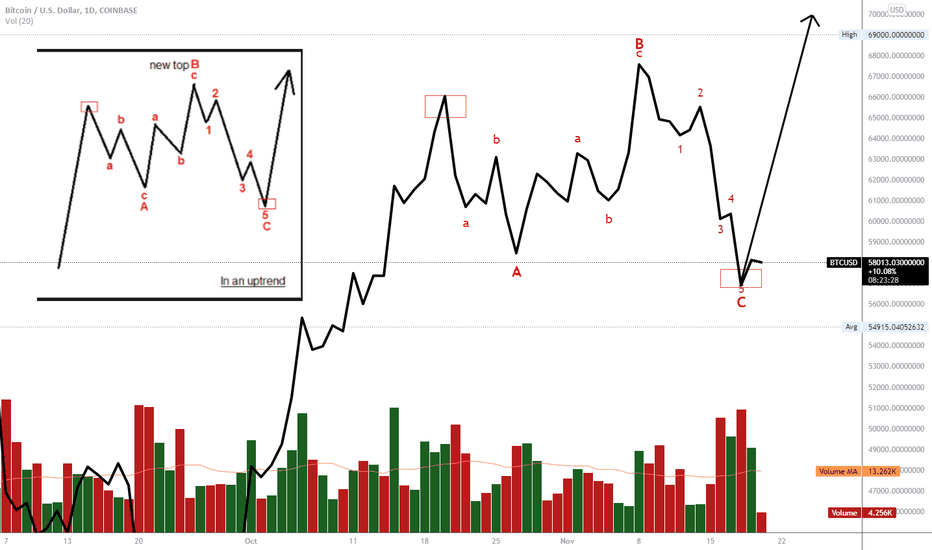
And here (where we also corrected lower than expected and have already made it back near previous highs):
For the bull now case, Bitcoin doesn't often re-test it's old support levels after an extended clear break above it, but it's still possible that it does do it, this time.
If this pattern remains relevant, then we won't see a new ATH until sometime around mid-late 2022, and we could drop down as low as 14.5-20k.
Confluence added to this idea via Daily 50 & 200 MAs and Weekly 100 & 200 MAs, which all point to prices potentially stopping at the suggested levels. That said, note that our daily 50/200 recently printed a Golden Cross (yet, it is still possible we that cross back/forth multiple times within the current structure before confirming a direction, especially considering we saw a death cross just prior).
I'm still of the mind that we are in a bull market that isn't yet complete and is preparing for a blow off top. This scenario just means that happens much later, and provides more opportunity for accumulation beforehand.
The alternative is that we still are in an expanded flat on the lower timeframes, it simply corrected lower than expected, and is about to print a blow off top in the more immediate future, similar to what S&P500 appears to be doing now, and as previously suggested here:
And here (where we also corrected lower than expected and have already made it back near previous highs):

Publications connexes
Clause de non-responsabilité
Les informations et publications ne sont pas destinées à être, et ne constituent pas, des conseils ou recommandations financiers, d'investissement, de trading ou autres fournis ou approuvés par TradingView. Pour en savoir plus, consultez les Conditions d'utilisation.
Publications connexes
Clause de non-responsabilité
Les informations et publications ne sont pas destinées à être, et ne constituent pas, des conseils ou recommandations financiers, d'investissement, de trading ou autres fournis ou approuvés par TradingView. Pour en savoir plus, consultez les Conditions d'utilisation.