
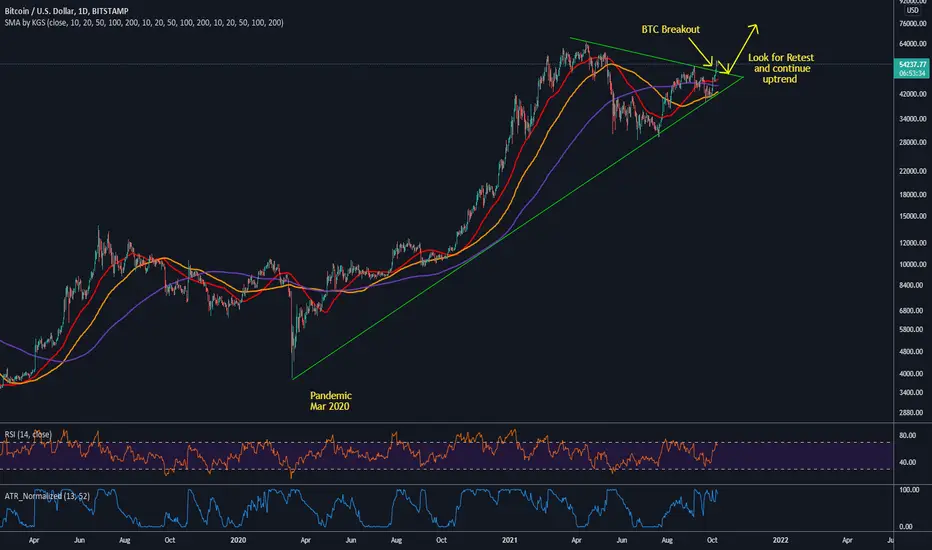
Bitcoin has broken through its current pennant pattern (marked on the chart with green lines) and will be looking for a new all time high in the coming weeks, perhaps even days.
Usually the trend will come back down and retest previous resistance levels (marked with the top green line on the chart) to see if it can find support. If it does, this is a bullish signal and BTC will attempt to move up towards levels of it's previous all time high (ATH).
Look for the retest of the top green line and then a move upwards towards new ATH's.
Usually the trend will come back down and retest previous resistance levels (marked with the top green line on the chart) to see if it can find support. If it does, this is a bullish signal and BTC will attempt to move up towards levels of it's previous all time high (ATH).
Look for the retest of the top green line and then a move upwards towards new ATH's.
Note
Price discovery mode activated.
Clause de non-responsabilité
Les informations et publications ne sont pas destinées à être, et ne constituent pas, des conseils ou recommandations financiers, d'investissement, de trading ou autres fournis ou approuvés par TradingView. Pour en savoir plus, consultez les Conditions d'utilisation.
Clause de non-responsabilité
Les informations et publications ne sont pas destinées à être, et ne constituent pas, des conseils ou recommandations financiers, d'investissement, de trading ou autres fournis ou approuvés par TradingView. Pour en savoir plus, consultez les Conditions d'utilisation.