
BTC/USD — Long-Term Technical Analysis 📊
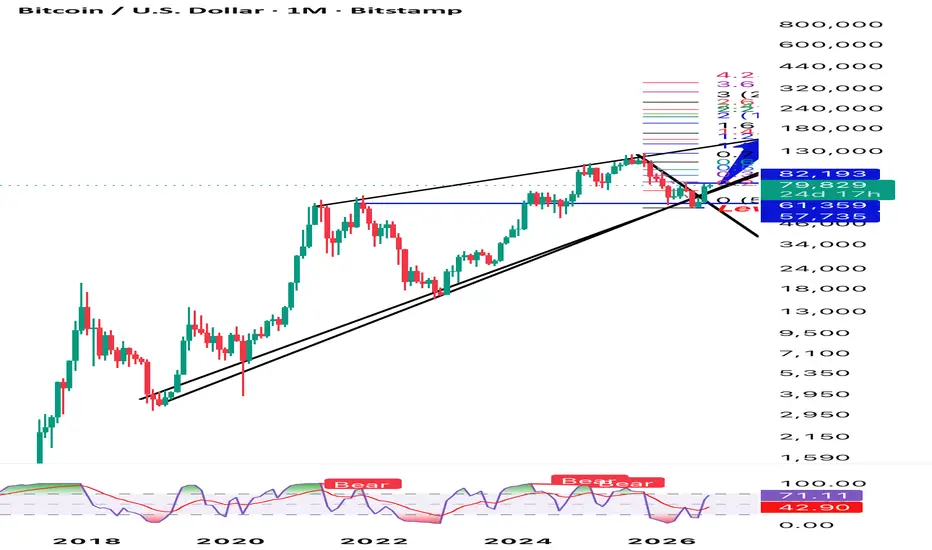
Bitcoin is currently trading around $79.8K, with price approaching a major resistance and breakout zone around $82.2K.
The monthly chart shows a long-term bullish structure supported by the rising trendline from previous major cycle lows. After the recent correction, BTC has bounced from the $57.7K–$61.4K support zone and is now testing the upper resistance area.
🔑 Key Levels
Resistance / Breakout
* $82.2K — key resistance and breakout level
* A monthly close above $82.2K would provide stronger confirmation of continuation.
* Holding above the breakout zone on a retest would strengthen the bullish setup.
Support / Risk
* $61.4K — major horizontal support
* $57.7K — critical support / invalidation area
* A sustained break below $57.7K would significantly weaken the bullish structure and invalidate this upside setup.
🎯 Fibonacci Upside Targets
If BTC confirms the breakout and maintains the long-term structure, the Fibonacci extensions on the chart give progressively higher objectives:
* $100K+ — psychological and initial upside objective
* $120K–$140K — major Fibonacci extension zone
* $160K–$180K — next extension area
* $200K+ — major long-term Fibonacci target
* $280K–$400K — extended Fibonacci targets for a strong long-term continuation
🛑 Stop-Loss / Invalidation
For a breakout setup, risk should be managed around the major support structure. A monthly loss of $57.7K would be the key technical invalidation level for this bullish thesis.
The preferred scenario is:
$82.2K breakout → successful retest → continuation toward $100K → $120K–$140K → $160K–$180K → $200K+ Fibonacci extensions.
The alternative scenario is rejection at $82.2K followed by a loss of $61.4K, which could bring the $57.7K support into focus.
This analysis is based on the chart’s long-term structure and Fibonacci extensions. These are technical levels, not guaranteed price targets or financial advice.
Bitcoin is currently trading around $79.8K, with price approaching a major resistance and breakout zone around $82.2K.
The monthly chart shows a long-term bullish structure supported by the rising trendline from previous major cycle lows. After the recent correction, BTC has bounced from the $57.7K–$61.4K support zone and is now testing the upper resistance area.
🔑 Key Levels
Resistance / Breakout
* $82.2K — key resistance and breakout level
* A monthly close above $82.2K would provide stronger confirmation of continuation.
* Holding above the breakout zone on a retest would strengthen the bullish setup.
Support / Risk
* $61.4K — major horizontal support
* $57.7K — critical support / invalidation area
* A sustained break below $57.7K would significantly weaken the bullish structure and invalidate this upside setup.
🎯 Fibonacci Upside Targets
If BTC confirms the breakout and maintains the long-term structure, the Fibonacci extensions on the chart give progressively higher objectives:
* $100K+ — psychological and initial upside objective
* $120K–$140K — major Fibonacci extension zone
* $160K–$180K — next extension area
* $200K+ — major long-term Fibonacci target
* $280K–$400K — extended Fibonacci targets for a strong long-term continuation
🛑 Stop-Loss / Invalidation
For a breakout setup, risk should be managed around the major support structure. A monthly loss of $57.7K would be the key technical invalidation level for this bullish thesis.
The preferred scenario is:
$82.2K breakout → successful retest → continuation toward $100K → $120K–$140K → $160K–$180K → $200K+ Fibonacci extensions.
The alternative scenario is rejection at $82.2K followed by a loss of $61.4K, which could bring the $57.7K support into focus.
This analysis is based on the chart’s long-term structure and Fibonacci extensions. These are technical levels, not guaranteed price targets or financial advice.

Clause de non-responsabilité
Les informations et publications ne sont pas destinées à être, et ne constituent pas, des conseils ou recommandations financiers, d'investissement, de trading ou autres fournis ou approuvés par TradingView. Pour en savoir plus, consultez les Conditions d'utilisation.
Clause de non-responsabilité
Les informations et publications ne sont pas destinées à être, et ne constituent pas, des conseils ou recommandations financiers, d'investissement, de trading ou autres fournis ou approuvés par TradingView. Pour en savoir plus, consultez les Conditions d'utilisation.